BPNN Predictor with Smoothing
Indicator

BPNN Predictor with Smoothing

iMA

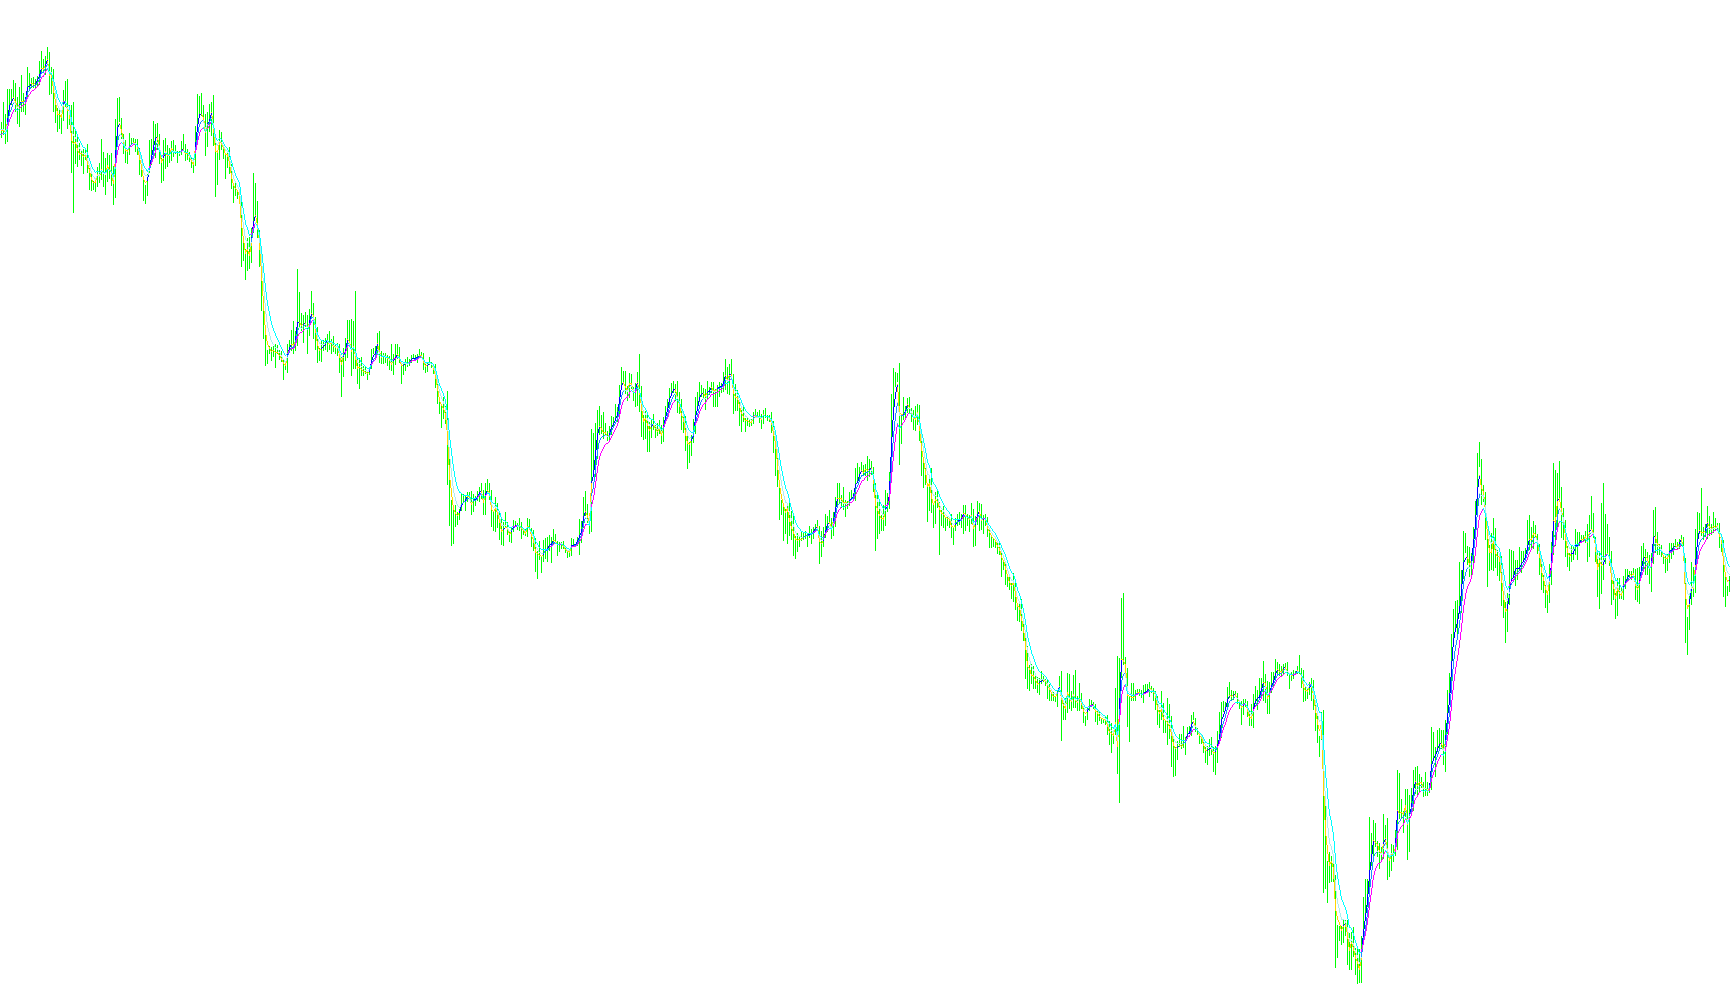
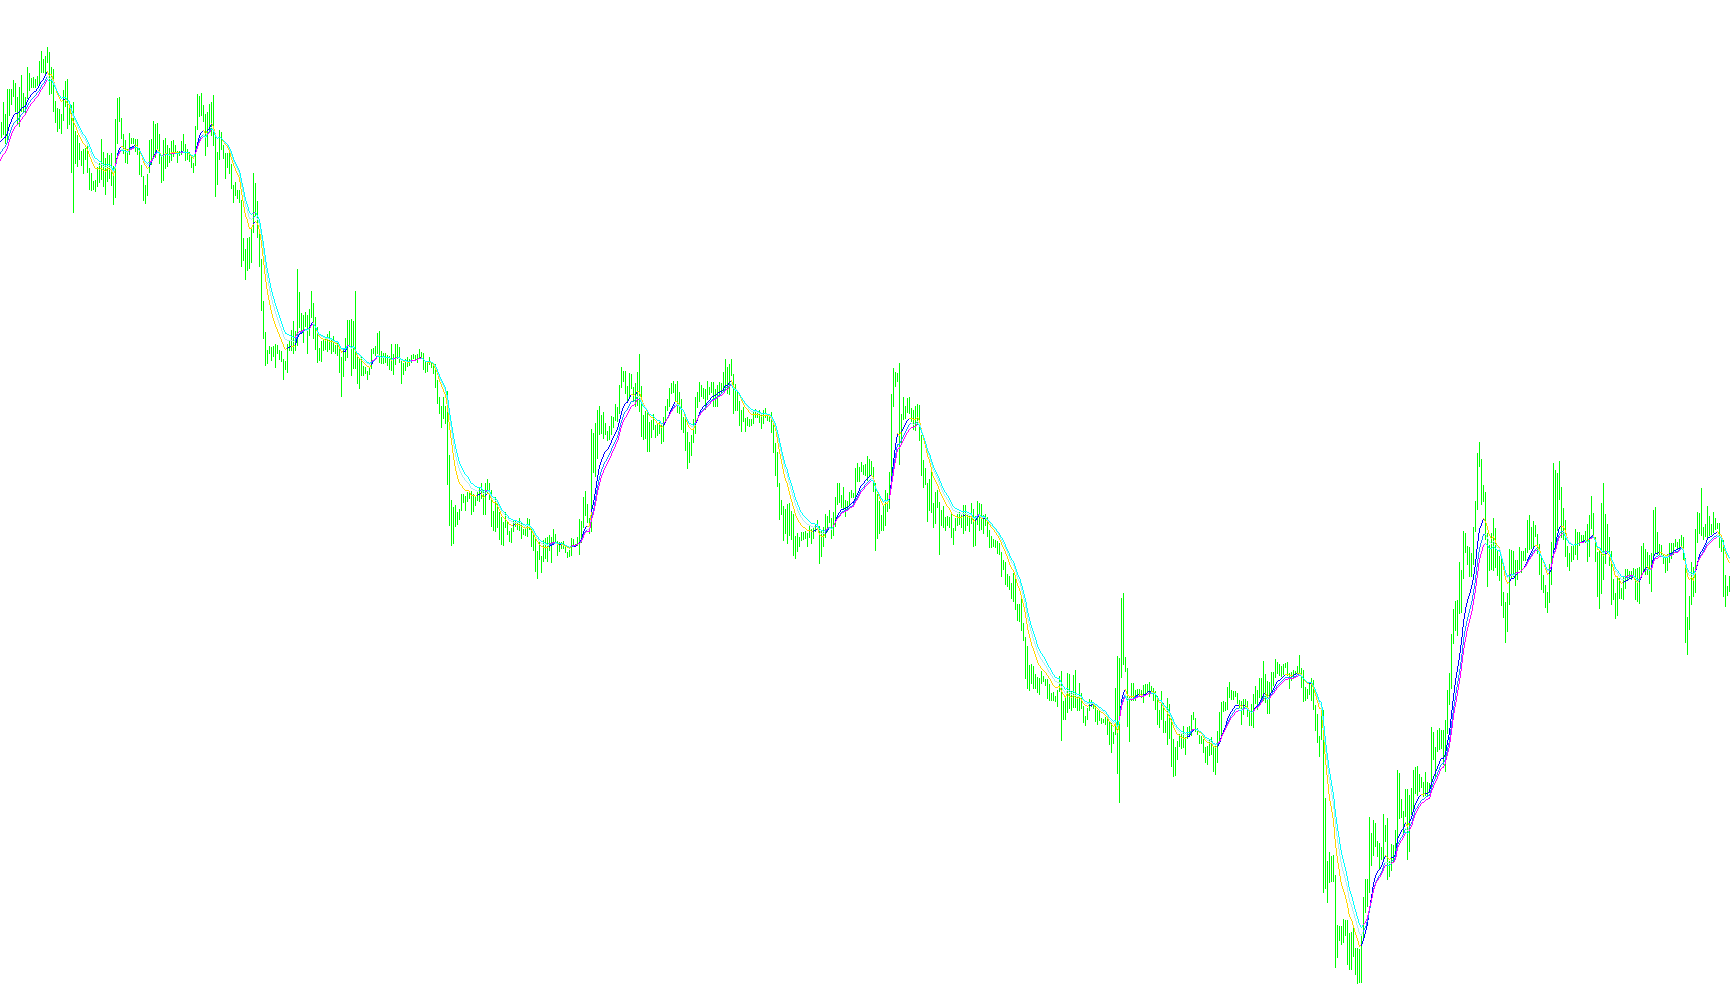
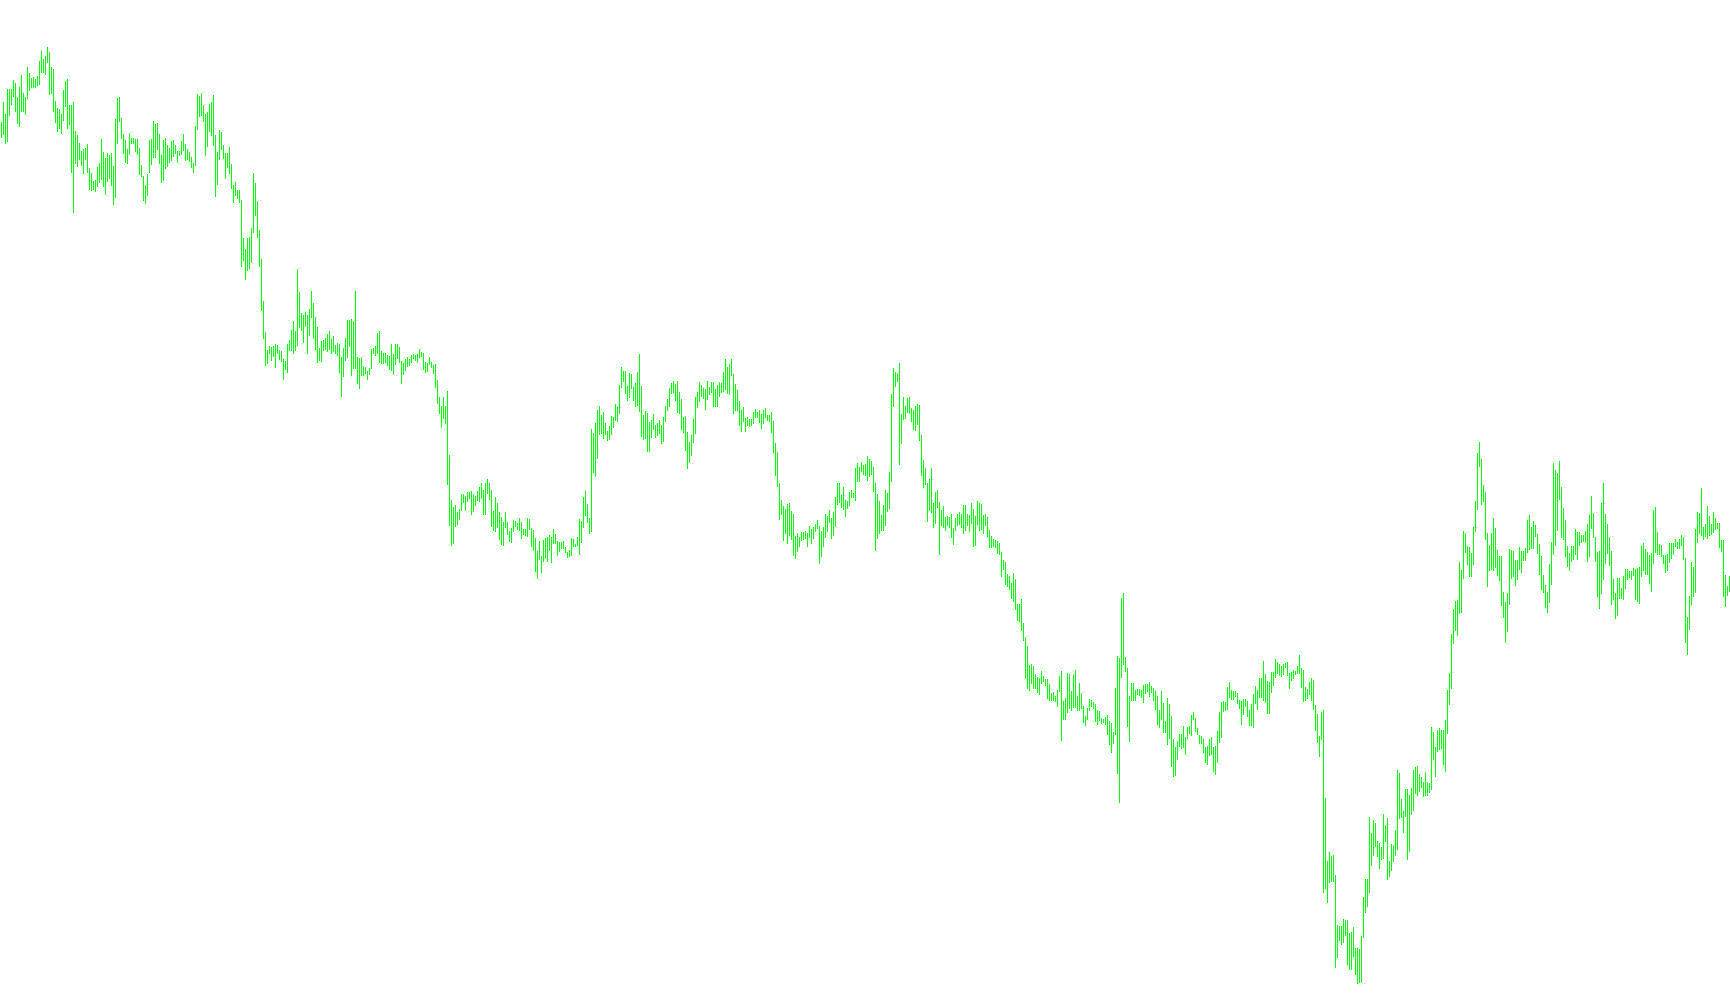
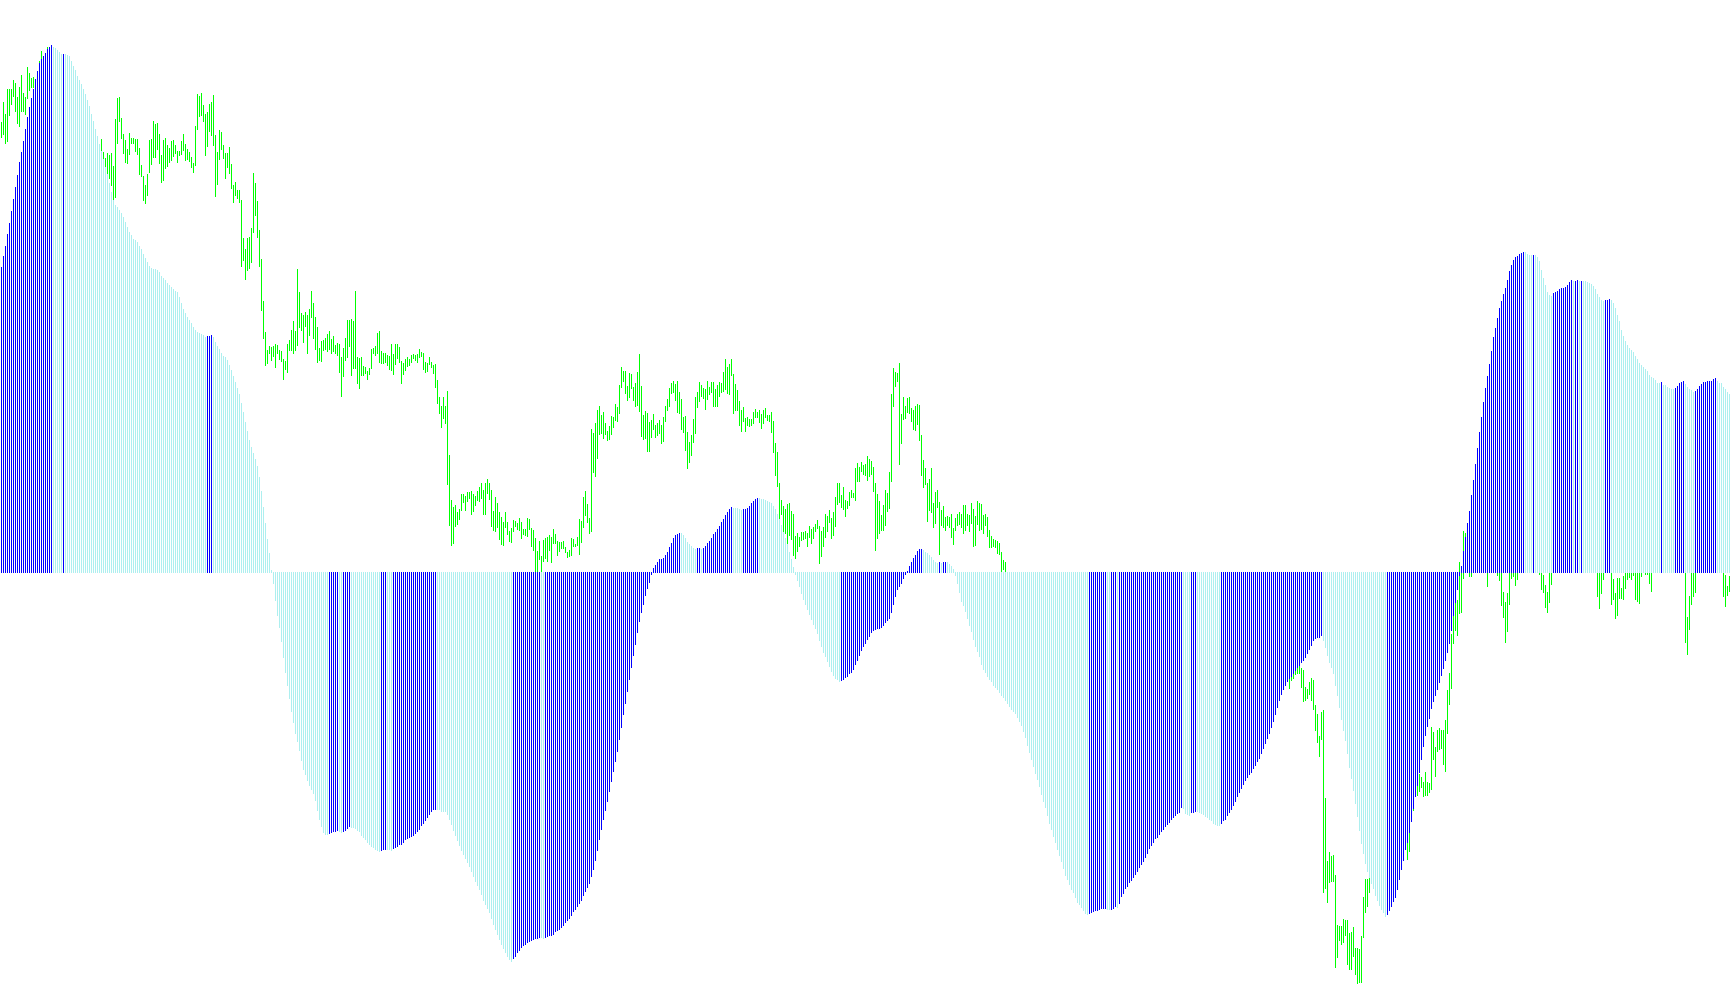
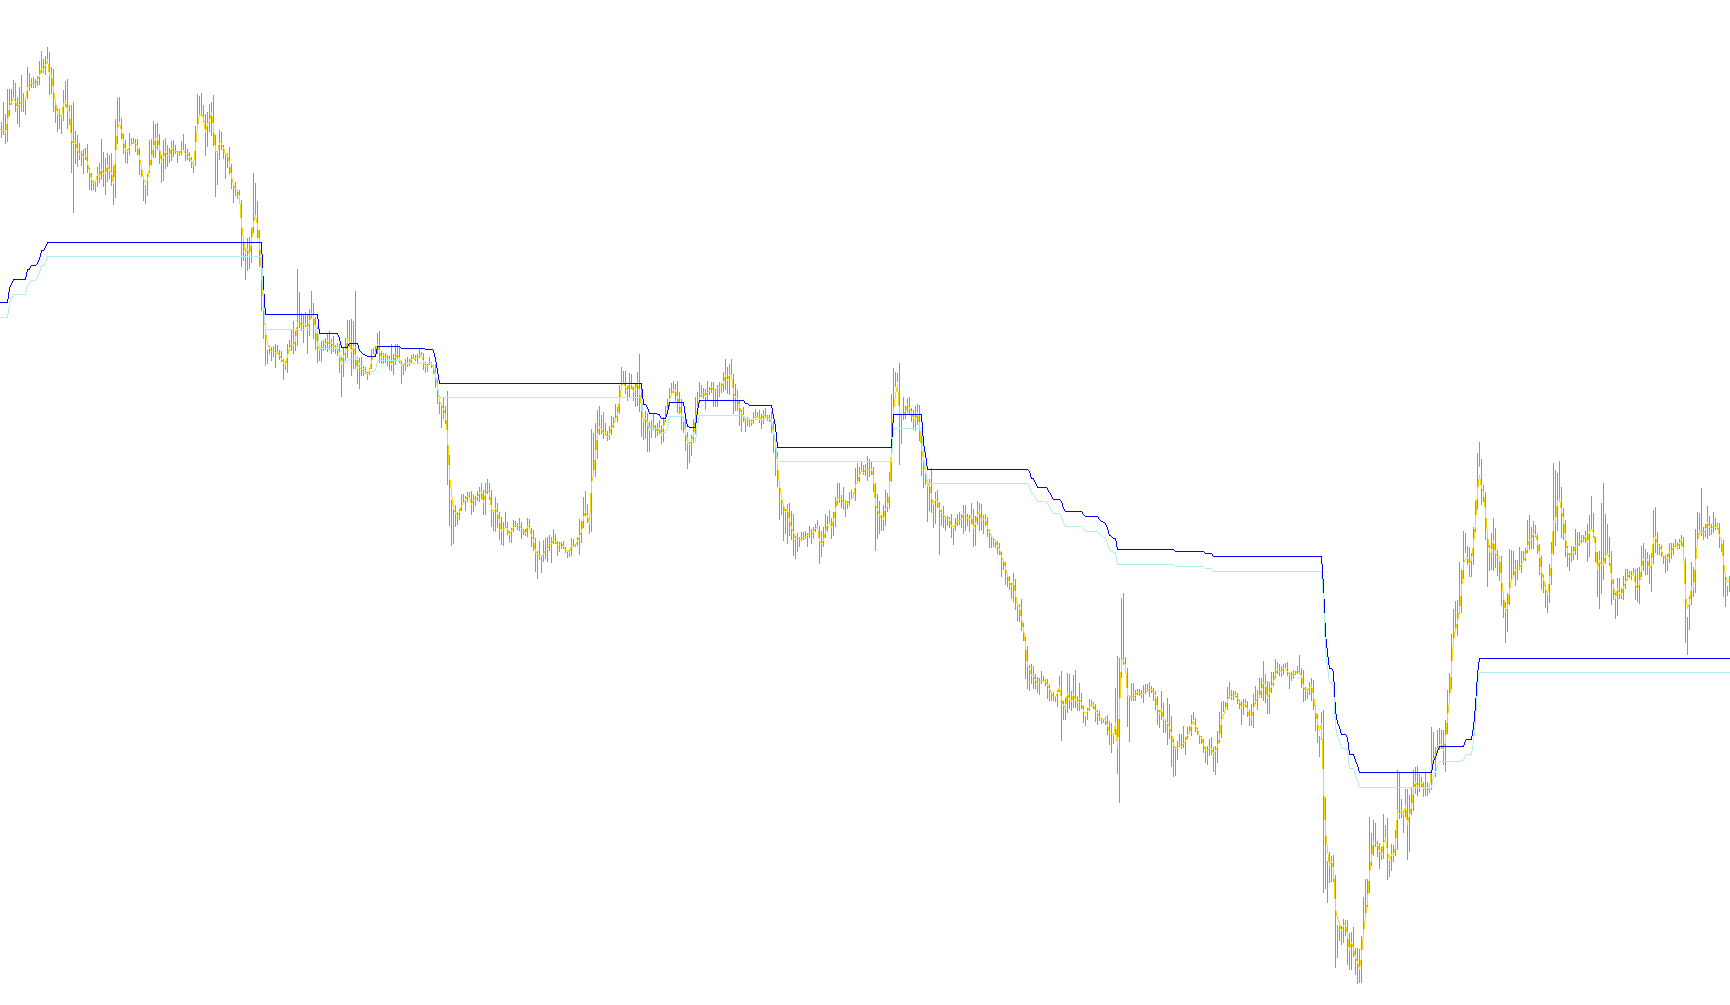
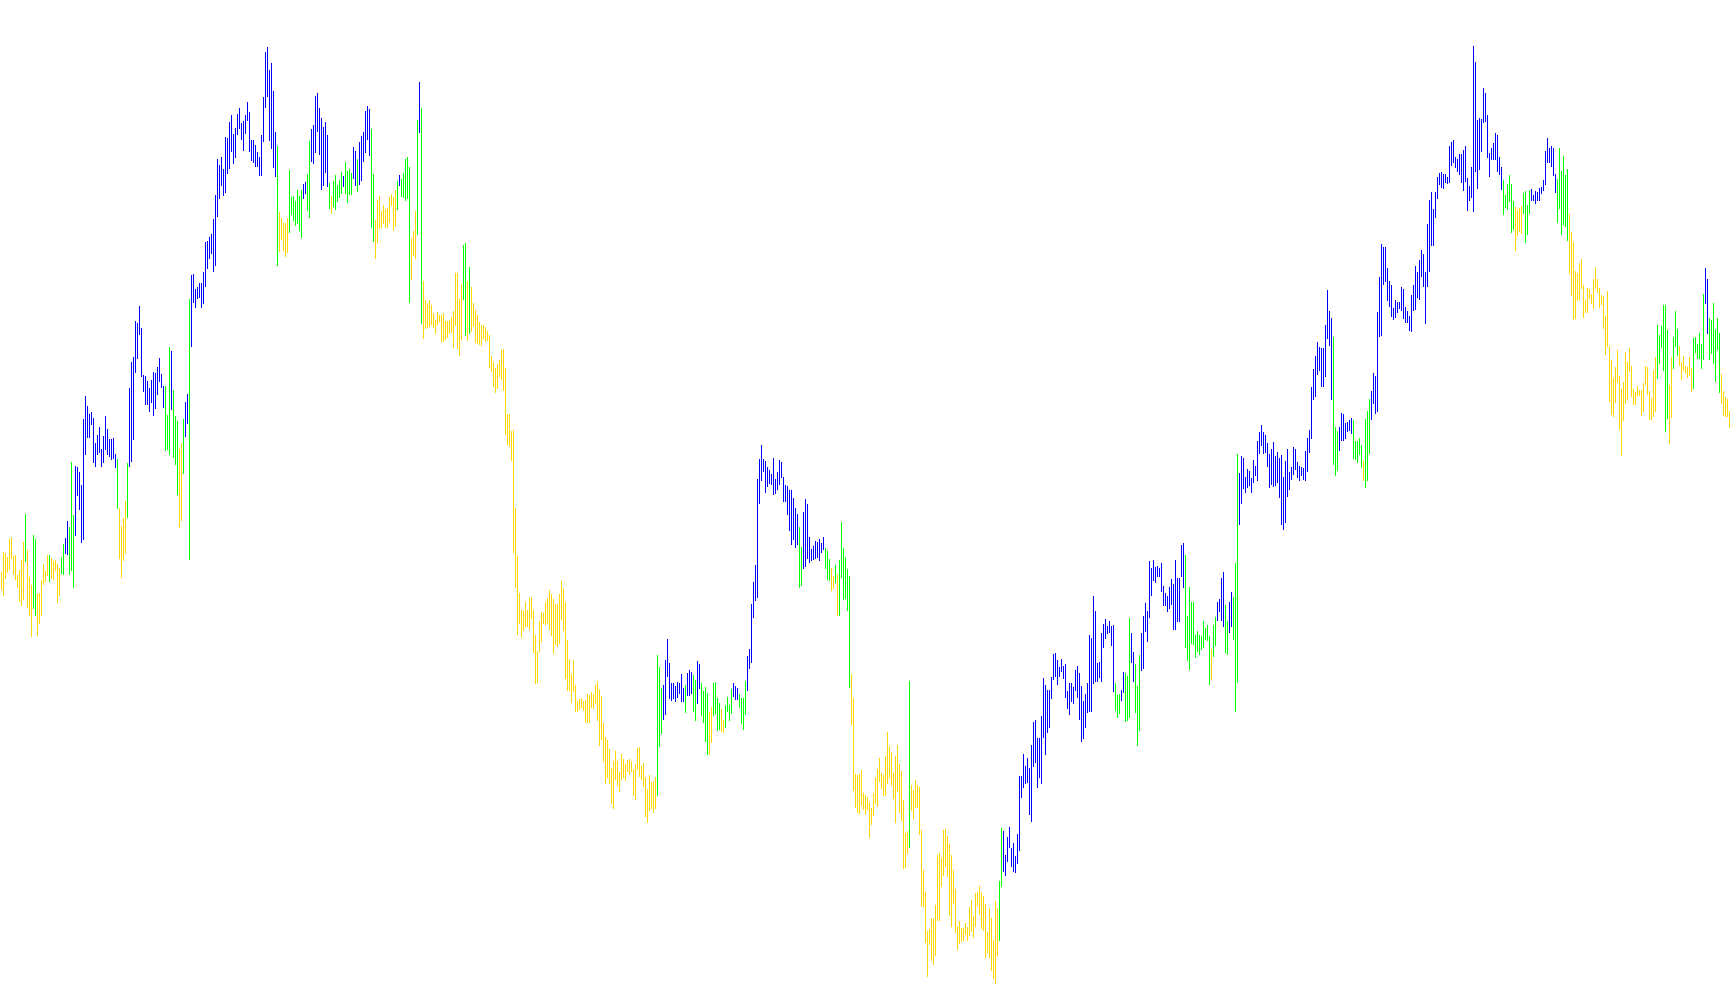
Utilizes a Backpropagation Neural Network (BPNN) to forecast price trajectories by processing smoothed EMA data through multi-layered neurons using Fibonacci-sequence temporal delays.

breath of currency_test2en
Indicator

breath of currency_test2en

iMA

This indicator projects historical price volatility, expected daily/weekly ranges, and multi-period moving average deviations onto the chart to identify liquidity zones and trend continuations.

Brooky_ma_close
Indicator

Brooky_ma_close

iMA

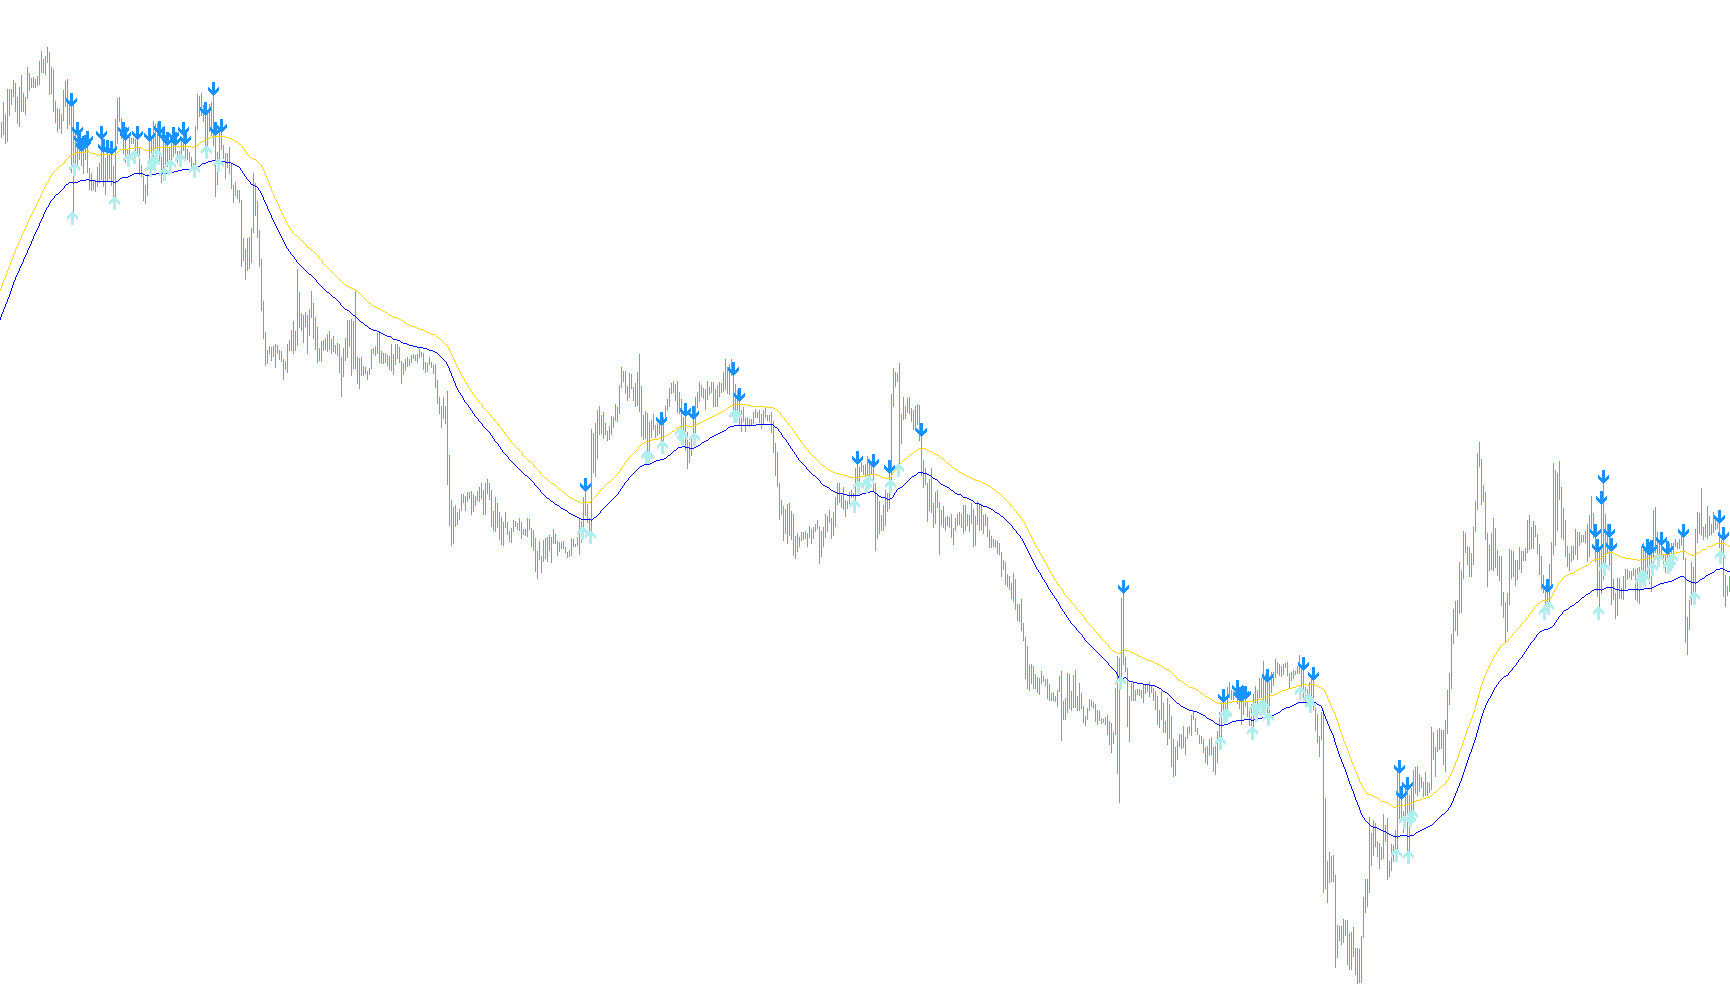
The system identifies potential trend reversals by detecting price penetration of high and low moving average envelopes combined with closing price reactions.

Brooky_Strength_rev_1
Indicator

Brooky_Strength_rev_1

iMAOnArrayiMA

This indicator calculates a cumulative sentiment score by evaluating the directional momentum of multiple currency pairs against a base currency to determine relative market dominance.

Brooky_Trend_Strength
Indicator

Brooky_Trend_Strength

iATRiMAiMAOnArrayiStdDev

This indicator quantifies market trend intensity by calculating the differential between Standard Deviation and Average True Range, filtered through price action sensitivity and moving average directionality.

Brooky_USD_Strength
Indicator

Brooky_USD_Strength

iMAiMAOnArray

This indicator quantifies the relative strength of the US Dollar by aggregating weighted momentum signals from seven major and minor currency pairs using linear weighted moving average crossovers.

BS_#MarketPrice
Indicator

BS_#MarketPrice

iMA

This indicator provides a real-time visual dashboard aggregating multi-timeframe trend dynamics, daily volatility averages, and live spread metrics to offer an immediate snapshot of market sentiment.

BS__MarketPrice
Indicator

BS__MarketPrice

iMA

A comprehensive visual dashboard that synchronizes real-time price action, multi-timeframe moving average trends, daily volatility averages, and spread dynamics into a single unified display.

Bulls Bears Power
Indicator

Bulls Bears Power

iMA

This indicator quantifies market imbalance by measuring the variance between the current price range and its long-term moving average mean.

Indicator

BULLS-BEARS-4XTRAFFIC

iBearsPoweriBullsPoweriMA
Indicator

BULLS-BEARS-4XTRAFFIC2

iBearsPoweriBullsPoweriMAiSAR
Indicator

BULLS-BEARS-4XTRAFFIC2_v1

iBearsPoweriBullsPoweriMAiSAR
Indicator

BULLS-BEARS-4XTRAFFIC2_v2

iBearsPoweriBullsPoweriMAiSAR
Indicator

BULLS-BEARS-4XTRAFFIC2_v3

iBearsPoweriBullsPoweriMAiSAR
Bulls
Indicator

Bulls

iMA

This indicator calculates the vertical distance between the current candle's high price and its corresponding Exponential Moving Average to quantify bullish expansion.

BullsBears_ma_sigma
Indicator

BullsBears_ma_sigma

iMAiMAOnArray

This indicator quantifies market sentiment by calculating the differential between high and low exponential moving averages relative to a primary trend baseline.

Bulls_mod_rickW
Indicator

Bulls_mod_rickW

iMAiMAOnArray

The indicator quantifies price strength by calculating the absolute distance between the current high and a smoothed exponential moving average, then applies a secondary simple moving average to filter trend signals.

Bull_Bears_alerts_1a
Indicator

Bull_Bears_alerts_1a

iMA

The indicator calculates the sum of price deviations from a moving average to identify bullish and bearish momentum shifts via histogram peaks.

Bunnygirl Cross and Daily Open 10
Indicator

Bunnygirl Cross and Daily Open 10

iMA

This indicator identifies bullish and bearish trend shifts by detecting momentum crossovers between two moving averages, incorporating a price bounce threshold and specific session time filters.

Bunnygirl Cross and Daily Open 10_v1
Indicator

Bunnygirl Cross and Daily Open 10_v1

iMA

This indicator detects moving average crossovers and price bounces while integrating daily open levels and time-restricted volatility filters.

Bunnygirl Cross and Daily Open
Indicator

Bunnygirl Cross and Daily Open

iMA

This indicator identifies trend reversals and momentum shifts by detecting the crossover or 'bounce' of a short-term moving average against a long-term baseline, validated against daily open levels and specific temporal filters.

Bunnygirl Cross and Daily Open_v1
Indicator

Bunnygirl Cross and Daily Open_v1

iMA

This indicator identifies trend reversals by calculating the intersection of moving averages and specific price bounces, while simultaneously tracking daily opening prices to establish structural boundaries.

Bunnygirl Cross and Daily Open_v2
Indicator

Bunnygirl Cross and Daily Open_v2

iMA

This indicator identifies bullish and bearish trend shifts by detecting moving average crossovers and price bounces, applying specific time-based filters and dynamic buffer zones for trade entry signals.

Bunnygirl_Cross_and_Daily_Open_10
Indicator

Bunnygirl_Cross_and_Daily_Open_10

iMA

This indicator identifies trend reversals by detecting moving average crossovers and price bounces while filtering signals against the daily open and specific time windows.

buy zone fibs
Indicator

buy zone fibs

iMA

This indicator projects parallel price bands based on varying Fibonacci multipliers relative to a dynamically calculated moving average of the high prices.

BuySell_Filter
Indicator

BuySell_Filter

iMA

This indicator categorizes market sentiment into four distinct states by evaluating the relative positioning of two short-term moving averages against two longer-term averages.

BuySell_v2
Indicator

BuySell_v2

iMA

This indicator maps the relative positioning of three Simple Moving Averages to visualize trend strength and directional bias through a four-state histogram.

buy_sell
Indicator

buy_sell

iATRiMA

The indicator identifies trend direction by comparing consecutive moving average shifts and projecting signals based on ATR volatility thresholds.

buzzer
Indicator

buzzer

iMA

This indicator utilizes a weighted harmonic oscillation formula and standard deviation filtering to identify directional shifts in price momentum through smoothed trend buffers.

b_v2_macd_osmax
Indicator

b_v2_macd_osmax

iOsMAiMAiMAOnArray
Candle MA Long
Indicator

Candle MA Long

iMA

Identifies directional bias by visualizing the ascending trajectory of three concurrent exponential moving averages to highlight active price momentum.

Candle MA Long_
Indicator

Candle MA Long_

iMA

This indicator identifies trend momentum by mapping three distinct exponential moving averages and highlighting their upward trajectory through directional slope filtering.

Candle MA Short
Indicator

Candle MA Short

iMA

This indicator visualizes rapid price momentum by plotting three overlapping Exponential Moving Averages and highlighting their upward directional shifts.

Candle MA Short_
Indicator

Candle MA Short_

iMA

This indicator identifies short-term trend dynamics by projecting three overlapping Exponential Moving Averages and highlighting bullish upward slopes through discrete visual segments.

CandleAverage_v3
Indicator

CandleAverage_v3

iMAiMAOnArray

This indicator quantifies price imbalance by comparing the distance between High and Close relative to the distance between Close and Low across smoothed exponential moving averages.

CANDLESTICK_001
Indicator

CANDLESTICK_001

iMA

This indicator identifies multiple advanced candlestick patterns, including Engulfing, Harami, and Morning/Evening Stars, while dynamically rendering visual support and resistance boundaries based on price action confirmation.

Indicator

Candle_Patterns

iMA
Indicator

Candle_Signal

iMA
Indicator

Candle_Signal_v2

iMA
CAO
Indicator

CAO

iMA

This indicator calculates the difference between two simple moving averages to generate a color-coded histogram that visually distinguishes increasing and decreasing price momentum.

carmens_eyes_v1.03
Indicator

carmens_eyes_v1.03

iMA

This indicator identifies trend reversals by monitoring price excursions beyond adaptive exponential moving average boundaries that expand dynamically based on real-time trade state and distance thresholds.

Carter_MA
Indicator

Carter_MA

iMA

This indicator overlays five distinct Exponential Moving Averages with periods of 8, 21, 50, 100, and 200 to visualize multi-timeframe trend dynamics.

CatBarColor
Indicator

CatBarColor

iMA

This indicator visually distinguishes price action by highlighting bars that trade entirely above or below a 50-period Exponential Moving Average.

Indicator

CatFX50

iATRiMA
Indicator

CatFX50b

iATRiMA
Indicator

CatFX50b_v1

iATRiMA
CatFx50K
Indicator

CatFx50K

iMA

This indicator identifies high-probability entry points by synchronizing dual stochastic oscillator crossovers with Exponential Moving Average price action and custom inverse trend volatility filters.

Indicator

CatFX50_last ver

iATRiMA
Indicator

CatFX50_last ver_v1

iATRiMA
Indicator

CatFX50_nk

iATRiMA