Complex_pairs
Indicator

Complex_pairs

iMA

This indicator synthesizes individual currency strengths into a unified value by calculating the weighted differential between moving averages across multiple major and minor forex pairs.

Complex_pairs1
Indicator

Complex_pairs1

iMA

This indicator calculates the arithmetic mean of smoothed price points derived from the spread between dual moving averages across dynamic timeframe-specific periods.

Complex_pairs1_v1
Indicator

Complex_pairs1_v1

iMA

The indicator calculates the numerical variance between two distinct moving average periods tailored specifically to the current chart's timeframe to reveal price momentum shifts.

Complex_pairs_v1
Indicator

Complex_pairs_v1

iMA

This indicator calculates a synthetic value for specific currency pairs by aggregating the weighted moving average differentials of underlying component currencies.

Cool2
Indicator

Cool2

iMA

The algorithm calculates the variance between a weighted median price and an smoothed moving average to project a logarithmic deviation from the baseline close.

Cool2_v1
Indicator

Cool2_v1

iMA

This indicator calculates price divergence by applying a logarithmic ratio between weighted median price components and smoothed moving averages.

Coppock
Indicator

Coppock

iMAiMAOnArray

This indicator identifies momentum shifts by calculating the sum of two distinct Rate of Change values derived from varying moving average distances and applying a final smoothing pass.

Coppock_v1
Indicator

Coppock_v1

iMAiMAOnArray

This indicator calculates the sum of two independent Rate of Change values derived from different moving average periods and applies a final smoothing layer to identify long-term momentum shifts.

Coppock_v2
Indicator

Coppock_v2

iMAiMAOnArray

This indicator quantifies market momentum by calculating the sum of two distinct Rate of Change values derived from long-term and short-term moving averages, then smoothing the result through a final moving average filter.

corelation
Indicator

corelation

iMA

This tool maps the price action of a secondary currency pair onto the primary chart by calculating proportional scale factors and positional offsets to visualize real-time correlations.

Correlation
Indicator

Correlation

iMA

This indicator quantifies the linear relationship between two distinct financial symbols by calculating the normalized product of their respective price deviations from a Simple Moving Average.

CorrelationBurst
Indicator

CorrelationBurst

iMA

This indicator calculates the relative price velocity of four major currency pairs using Linear Weighted Moving Averages to visualize synchronized momentum shifts.

Correlation_njel
Indicator

Correlation_njel

iMA

This indicator calculates the Pearson correlation coefficient between a primary base currency and multiple assets across ten distinct lookback periods to visualize price synchronization patterns.

correlation_v1
Indicator

correlation_v1

iMA

This indicator quantifies the Pearson correlation coefficient between two assets by measuring the statistical relationship of their price deviations from a Simple Moving Average.

Correlation_v1_v1
Indicator

Correlation_v1_v1

iMA

This indicator quantifies the statistical relationship between two financial instruments by measuring the coefficient of covariance relative to their respective deviations from simple moving averages.

Indicator

correlation_v2

iMA
Correlation_v3.1_kroufr
Indicator

Correlation_v3.1_kroufr

iMA

This indicator quantifies the statistical linear relationship between a base currency and the current symbol across distinct short-term and long-term temporal windows.

CosMod
Indicator

CosMod

iMA

This indicator maps the periodic trigonometric variance of price action relative to a simple moving average baseline.

Cowabunga
Indicator

Cowabunga

iMACDiMAiRSIiStochastic

This indicator identifies bullish and bearish momentum by synchronizing H4 timeframe trend filters—incorporating EMA crossovers, RSI levels, and Stochastic shifts—with real-time MACD and Stochastic trigger signals on lower timeframes.

Critical Points
Indicator

Critical Points

iMA

This indicator projects five symmetric Fibonacci-based price levels relative to a Simple Moving Average to identify potential support and resistance zones.

Critical Points1
Indicator

Critical Points1

iMA

This indicator plots a dynamic symmetrical cluster of horizontal levels based on the deviation of Fibonacci sequence integers from a primary Simple Moving Average.

Critical Points1_v1
Indicator

Critical Points1_v1

iMA

This indicator projects dynamic horizontal price levels by calculating equidistant Fibonacci-based offsets from a moving average base.

Critical Points_v1
Indicator

Critical Points_v1

iMA

This indicator projects multi-layered Fibonacci price levels dynamically relative to a Simple Moving Average mean to identify potential trend exhaustion and reversal zones.

Critical Points_v2
Indicator

Critical Points_v2

iMA

This indicator projects dynamic horizontal support and resistance levels by applying Fibonacci-scaled offsets to a primary Simple Moving Average.

Critical_Points
Indicator

Critical_Points

iMA

This indicator projects dual-sided Fibonacci price levels dynamically anchored to a user-selectable moving average to identify potential reversal zones.

Critical_PointsV2
Indicator

Critical_PointsV2

iMA

This indicator projects a symmetrical grid of horizontal price levels based on various moving average types and specific Fibonacci-derived point offsets to identify potential support and resistance clusters.

Critical_PointsV2_v1
Indicator

Critical_PointsV2_v1

iMA

This indicator projects a symmetrical grid of Fibonacci-based price levels relative to a user-selectable moving average to identify potential reversal zones.

Critical_Points_v1
Indicator

Critical_Points_v1

iMA

This indicator projects symmetrical horizontal price levels based on various moving average types to identify potential structural pivot points and liquidity zones.

Cronex Demarker Bars
Indicator

Cronex Demarker Bars

iDeMarkeriMAOnArrayiMA

This indicator identifies trend reversals and momentum shifts by calculating a DeMarker oscillator value filtered through dual Linear Weighted Moving Averages to generate bullish, bearish, or neutral histogram signals.

Cronex Taichi Bars
Indicator

Cronex Taichi Bars

iIchimokuiMAOnArrayiMA
Cronex_Impulse_CD
Indicator

Cronex_Impulse_CD

iMAiMAOnArray

This indicator quantifies price action velocity by measuring the differential between weighted moving averages and smoothed extreme high/low boundaries to identify momentum shifts.

cross
Indicator

cross

iMA

This indicator identifies bullish and bearish trend reversals by detecting the specific crossover points between fast and slow exponential moving averages.

CrossedAlerts
Indicator

CrossedAlerts

iMA

This indicator monitors the real-time crossover of a rapid exponential moving average against a lagging exponential moving average to trigger immediate price trend shift notifications.

CrossedAlerts1
Indicator

CrossedAlerts1

iMA

This indicator monitors real-time price momentum by detecting specific directional shifts when a short-term exponential moving average crosses over or under a long-term baseline.

Indicator

CrossedAlerts2

iMA
CrossedAlerts_002
Indicator

CrossedAlerts_002

iMA

This indicator triggers real-time alerts by detecting instantaneous trajectory shifts when a 144-period exponential moving average pierces the 200-period trend line.

Indicator

Currency heat map - any

iMA
Indicator

CurrencyDeviation-V1b04

iMACDiMAiRSI
CurrencyPairsCorrelation
Indicator

CurrencyPairsCorrelation

iMAiMAOnArray

This indicator identifies significant price-to-moving-average deviations between two correlated currency pairs to highlight extreme momentum imbalances and potential reversal points.

Indicator

currency_strenght_fast.
iMA
currency_strenght_fast[1].
Indicator

currency_strenght_fast[1].

iMA

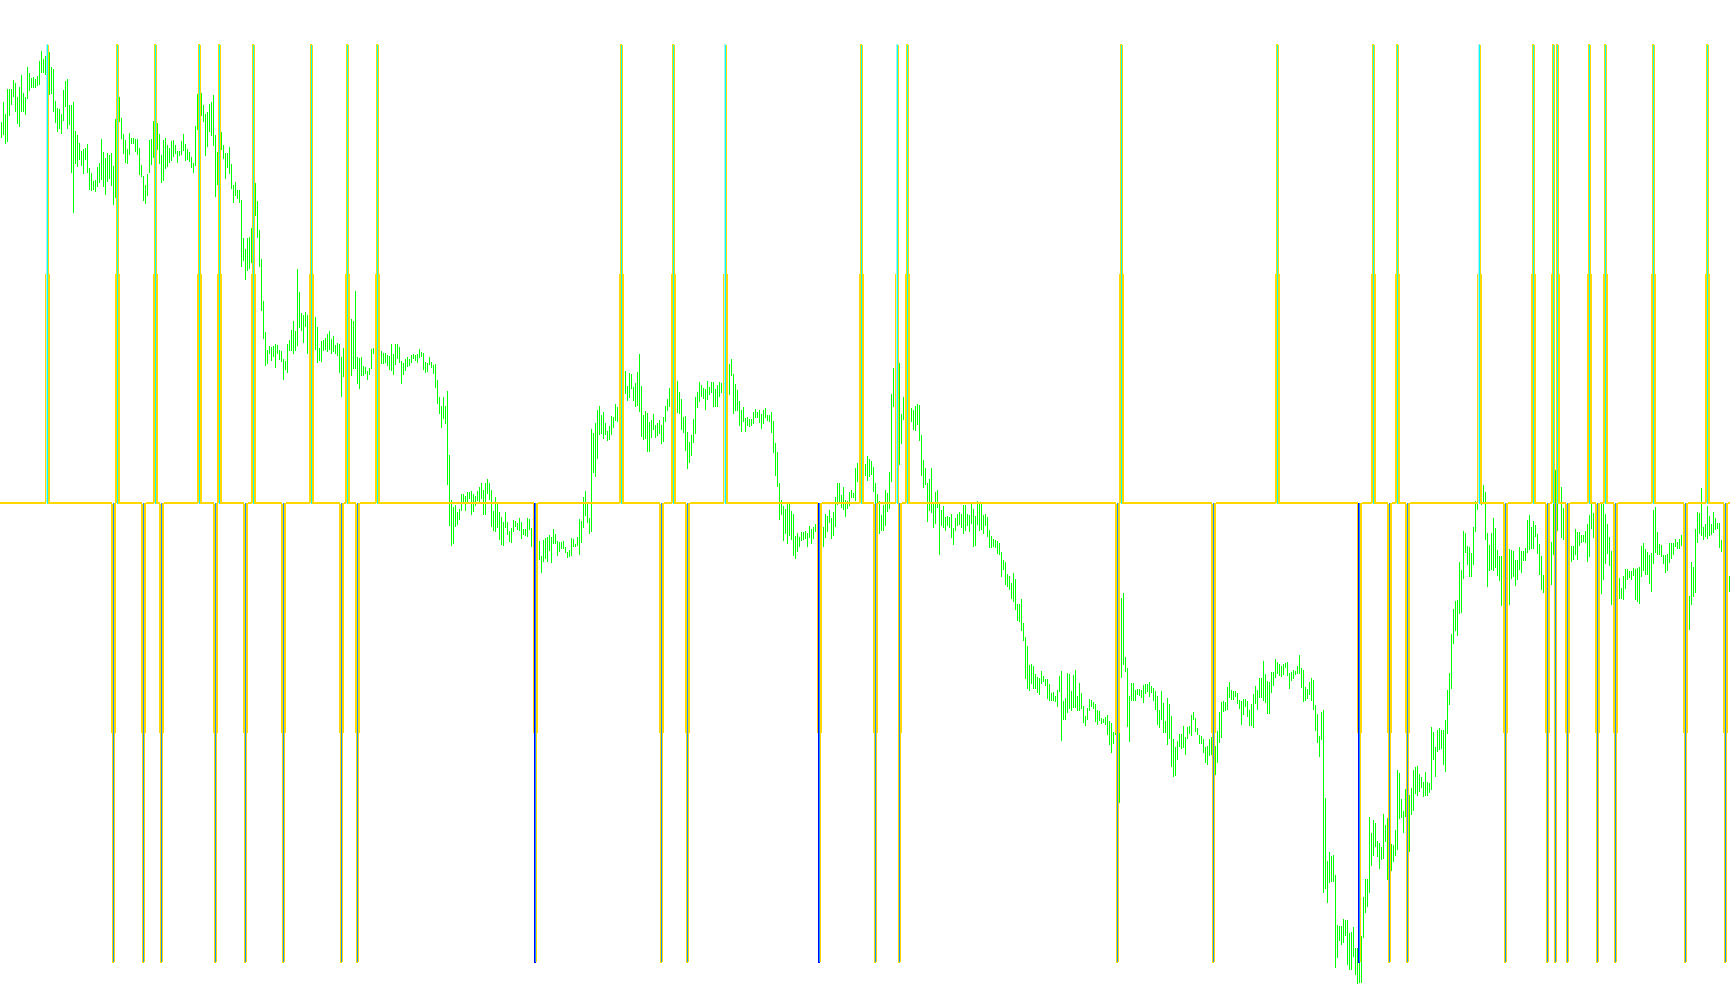
This indicator calculates a composite weighted average of moving average differentials across multiple currency pairs to determine the synthetic strength and relative momentum of specific underlying fiat currencies.

CUSIV01
Indicator

CUSIV01

iMA

Calculates the aggregate strength of the US Dollar by measuring the pip deviation between current prices and exponential moving averages across four major currency pairs.

cutz_trend
Indicator

cutz_trend

iMA

This indicator identifies trend reversals by synchronizing squared price action volatility with overlapping multi-period moving average crossovers.

CycleIdentifier
Indicator

CycleIdentifier

iMAiRSI

This indicator detects nested market fluctuations by identifying concurrent minor and major trend reversals using price action filters, zero-lag smoothing, and dynamic sweep thresholds.

CycleIdentifier2
Indicator

CycleIdentifier2

iMAiRSI

This indicator identifies nested market structural rotations by detecting multi-frequency price deviations and verifying trend persistence through Zero-Lag SMA/RSI smoothing filters.

CycleIdentifier2[LW]
Indicator

CycleIdentifier2[LW]

iMAiRSI

This indicator identifies nested market structures by detecting multi-scale price oscillations and momentum shifts through zero-lag filtering and weighted moving average sweeps.

CycleIdentifier_001
Indicator

CycleIdentifier_001

iMAiRSI

This indicator identifies nested market structures by detecting major and minor price oscillations through smoothed moving averages, zero-lag filtering, and dynamic range-based sweep thresholds.

Cycle_KROUFR_version
Indicator

Cycle_KROUFR_version

iMA

This indicator calculates a self-adjusting stochastic value based on an adaptive time period derived from the historical frequency of moving average crossovers.

Cycle_KROUFR_version_
Indicator

Cycle_KROUFR_version_

iMA

This indicator identifies cyclical price rhythms by calculating a stochastic oscillator derived from the MACD, using a dynamic period determined by the average frequency of moving average crossovers.

Cycle_KROUFR_version_001
Indicator

Cycle_KROUFR_version_001

iMA

This indicator calculates a dynamic cycle period based on historical moving average crossover frequencies to derive a stochastic momentum value for trend identification.