Indicator

D-Open Graphics

iMA
Daily Forex Signal
Indicator

Daily Forex Signal

iMACDiMAiRSIiStochastic

This indicator identifies high-probability entries by synchronizing exponential moving average trends across M30, H1, H4, and D1 timeframes with RSI and MACD momentum filters.
Daily Range Calculator
Indicator

Daily Range Calculator

iMA

This indicator calculates multi-period historical volatility to project potential price movement limits and determine risk-adjusted stop-loss levels based on custom reward ratios.

Daily Range Calculator_v1
Indicator

Daily Range Calculator_v1

iMA

This tool calculates multi-period daily volatility to determine dynamic price 'rooms' and projects optimal stop-loss levels based on a user-defined risk-to-reward ratio.

DDFX 8 Sentiment v3
Indicator

DDFX 8 Sentiment v3

iCCIiMA

This indicator identifies market bias by synchronizing Commodity Channel Index polarity with the directional slope of dual exponential moving average spreads.

DECEMA-a
Indicator

DECEMA-a

iMAiMAOnArray

The logic calculates a multi-layered smoothing effect by nesting exponential moving averages five levels deep and applying a weighted polynomial coefficient to generate an oscillator signal.

DECEMA_v1
Indicator

DECEMA_v1

iMA

The indicator calculates a high-order polynomial smoothing of an Exponential Moving Average to reduce noise and identify trend momentum.

DECEMA_v1_v1
Indicator

DECEMA_v1_v1

iMA

This indicator calculates a multi-stage recursive exponential moving average sequence and applies a specific weighted polynomial coefficients to generate a smoothed trend line.

Delta MA
Indicator

Delta MA

iMA

The indicator identifies price reversals by mapping historical closing prices from the lookback period onto current trend slopes to highlight structural pivot points.

Delta
Indicator

Delta

iMA

This indicator calculates and visualizes the real-time point distance between current market prices and two distinct exponential moving averages of varying periods.

DeltaAlert
Indicator

DeltaAlert

iMA

This indicator identifies trend reversals by monitoring the relative price displacement between two distinct exponential moving average distances.

DeltaAlert_001
Indicator

DeltaAlert_001

iMA

This indicator calculates the absolute point distance between the current market price and two distinct exponential moving averages to identify trend reversals based on relative divergence.

Delta_v1
Indicator

Delta_v1

iMA

This indicator quantifies the point-based spatial distance between current market prices and two distinct Exponential Moving Averages to visualize momentum divergence.

DEMA_RLH
Indicator

DEMA_RLH

iMAiMAOnArray

This indicator calculates a high-responsiveness trend line by subtracting the smoothed mean of an EMA from twice its original value to reduce lag.

DEMA_RLH_v1
Indicator

DEMA_RLH_v1

iMAiMAOnArray

This indicator calculates the Double Exponential Moving Average by subtracting a secondary smoothed EMA from twice the primary EMA to reduce lag while preserving price sensitivity.

DEMA_RLH_v2
Indicator

DEMA_RLH_v2

iMAiMAOnArray

This indicator calculates the Double Exponential Moving Average by subtracting the nested EMA from twice the primary EMA to reduce lag and increase responsiveness.

Detrended Price Oscillator
Indicator

Detrended Price Oscillator

iMA

This indicator quantifies momentum by calculating the raw distance between current closing prices and a shifted simple moving average.

Detrended_Price_Oscillator
Indicator

Detrended_Price_Oscillator

iMAiStdDevOnArray

Calculates the variance between current price action and moving average benchmarks while establishing volatility-based extreme zones to identify momentum exhaustion.

dex_HeLMA_v2.0
Indicator

dex_HeLMA_v2.0

iMA

This indicator calculates a multi-period volatility average to project price channels and filters directional momentum shifts using an EMA-weighted signal.

dex_MACDPVT
Indicator

dex_MACDPVT

iMAiMAOnArray

This indicator quantifies market momentum by calculating the cumulative weighted change in price relative to volume, applying a dual exponential moving average crossover strategy.

Didi_Index
Indicator

Didi_Index

iMA

The indicator normalizes price action by dividing short and long moving averages by a medium-term baseline to isolate relative momentum dynamics.

dinapli osilattor
Indicator

dinapli osilattor

iMA

The indicator quantifies market sentiment by calculating the instantaneous deviation between current closing prices and a smoothed simple moving average.

DiNapoli Detrend Oscillator ok
Indicator

DiNapoli Detrend Oscillator ok

iMA

This indicator isolates price action from the underlying trend by calculating the divergence between current closing prices and a fixed-period simple moving average.

DiNapoli Detrend Oscillator-HISTOGRAM
Indicator

DiNapoli Detrend Oscillator-HISTOGRAM

iMA

This indicator calculates the price variance by subtracting a 7-period Simple Moving Average from current closing prices to visualize momentum shifts away from the mean.

DiNapoli Detrend Oscillator
Indicator

DiNapoli Detrend Oscillator

iMA

Quantifies price action variance by isolating the distance between current closing prices and a short-term simple moving average to identify trend exhaustion.

DiNapoli Detrend Oscillator_v1
Indicator

DiNapoli Detrend Oscillator_v1

iMA

Measures market momentum by calculating the mathematical variance between current closing prices and a simple moving average to isolate price action from underlying trends.

Disparity Index
Indicator

Disparity Index

iMA

This indicator quantifies the percentage variance between the current market price and its exponential moving average to identify overextended trends.

Dist Ma
Indicator

Dist Ma

iMA

The logic quantifies momentum by incrementally aggregating consecutive price candles that close on the same side of a long-period simple moving average, resetting the tally whenever a crossover occurs.

divergenceviewer_ad
Indicator

divergenceviewer_ad

iMACDiMomentumiRVIiRSI

This indicator identifies and classifies complex price-momentum discrepancies by synchronizing market extremums with multiple technical oscillators, including William %R, RSI, MACD, and custom inputs.

DK-Multi Ma
Indicator

DK-Multi Ma

iMA

This indicator synchronizes eight independent moving average streams across distinct timeframes and periods to visualize complex trend convergence and structural momentum.

Doda-Donchian
Indicator

Doda-Donchian

iMA

This indicator identifies bullish and bearish entries by detecting price breaches of the Donchian Channel boundaries synchronized with specific EMA slope momentum thresholds.

Indicator

Doda-Donchian_v2_mod

iMA
Indicator

Doda-Donchian_v2_mod_fix

iMA
Doda-EMA
Indicator

Doda-EMA

iMA

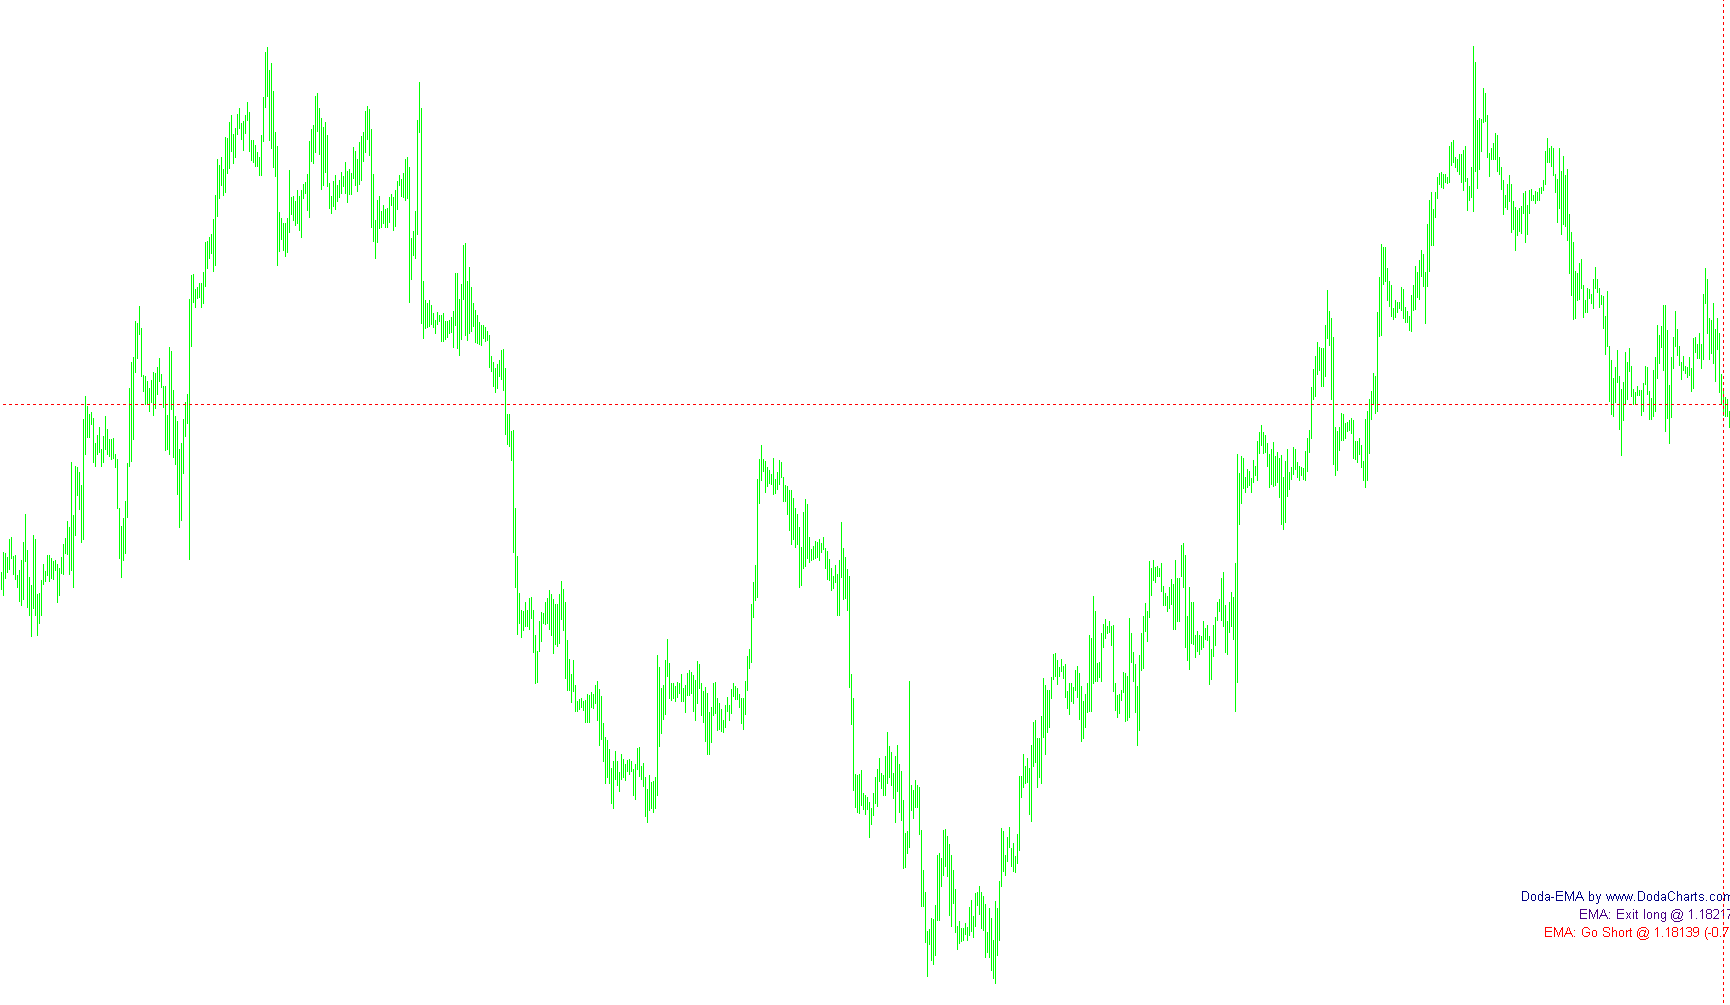
This indicator detects directional momentum by identifying stacked hierarchical ordering among three Exponential Moving Averages to trigger long and short entries and automated exit alerts.

Indicator

Dolly Graphics_v10_SmallText_OPEN_PIVOT

iMA
Indicator

Dolly Graphics_v5

iMA
Dolly_Graphics_v10_BT
Indicator

Dolly_Graphics_v10_BT

iMA

A comprehensive visual dashboard that synthesizes pivot point theory, Fibonacci retracement levels, and daily average range statistics to identify high-probability supply and demand zones.

Indicator

Dolly_Graphics_v11-GMTShift

iMA
DonchianChannel-mql-file
Indicator

DonchianChannel-mql-file

iMA

This indicator identifies bullish and bearish reversals by detecting price breaches of the Donchian Channel boundaries synchronized with a specific positive or negative exponential moving average slope threshold.

dots
Indicator

dots

iMA

This indicator identifies trend direction by calculating weighted price curve angles to generate visual signals based on sequential momentum shifts.

DPO
Indicator

DPO

iMA

This indicator quantifies price deviation from a smoothed moving average by isolating the oscillatory component of the price action to identify overextended market cycles.

DPO_alert
Indicator

DPO_alert

iMA

This indicator isolates directional momentum by calculating the variance between short-term price action and a lagged moving average to identify zero-line crossovers.

dpo_mtf
Indicator

dpo_mtf

iMA

This indicator quantifies momentum shifts by calculating the arithmetic difference between two distinct moving average periods across synchronized higher timeframes.

DPO_v1
Indicator

DPO_v1

iMA

This indicator quantifies the immediate price variance from a shifted Simple Moving Average to highlight momentum shifts.

DPO_v2
Indicator

DPO_v2

iMA

This indicator quantifies market momentum by calculating the arithmetic difference between current closing prices and their smoothed simple moving average.

ds_HDiv_OsMA_01
Indicator

ds_HDiv_OsMA_01

iMAiMAOnArray

This indicator identifies trend reversals by detecting structural discrepancies between price action and the Oscillator of Moving Averages (OsMA) using fractal pivot points.

DTS-InfoTrade
Indicator

DTS-InfoTrade

iCCIiMACDiRSIiStochastic

This indicator aggregates MACD, RSI, Stochastic, and CCI data across multiple timeframes to provide a real-time visual heatmap of trend sentiment and volatility metrics.

dzani9_Elliotwave_confirmation
Indicator

dzani9_Elliotwave_confirmation

iMA

This indicator identifies trend reversal points by detecting specific crossover alignments between two Linear Weighted Moving Averages while filtering signals based on local price volatility ranges.

Dzani9_Minor_in_Major_Elliott_Wave
Indicator

Dzani9_Minor_in_Major_Elliott_Wave

iMA

The logic identifies structural momentum shifts by tracking the directional slope of a dual SMA differential to isolate trend-reversal points.

Ehlers Fisher transform histo
Indicator

Ehlers Fisher transform histo

iMA

This indicator normalizes price oscillations into a bounded range using a sigmoid-like transform to highlight momentum shifts and trend exhaustion.