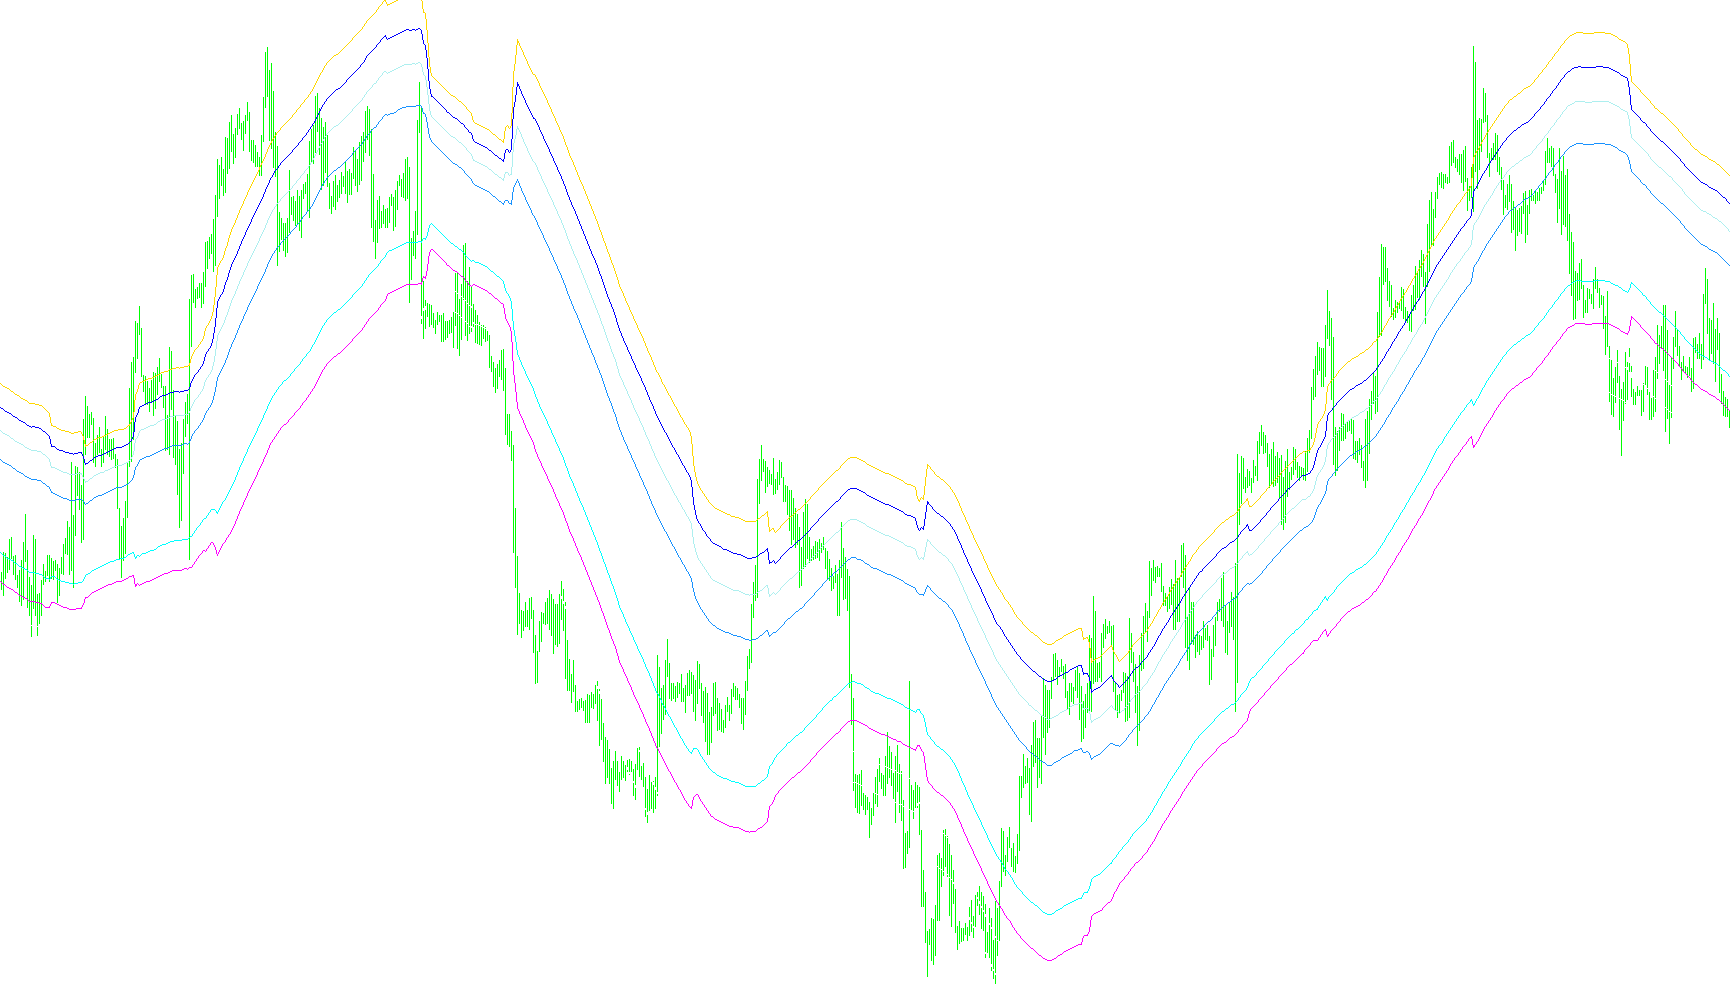
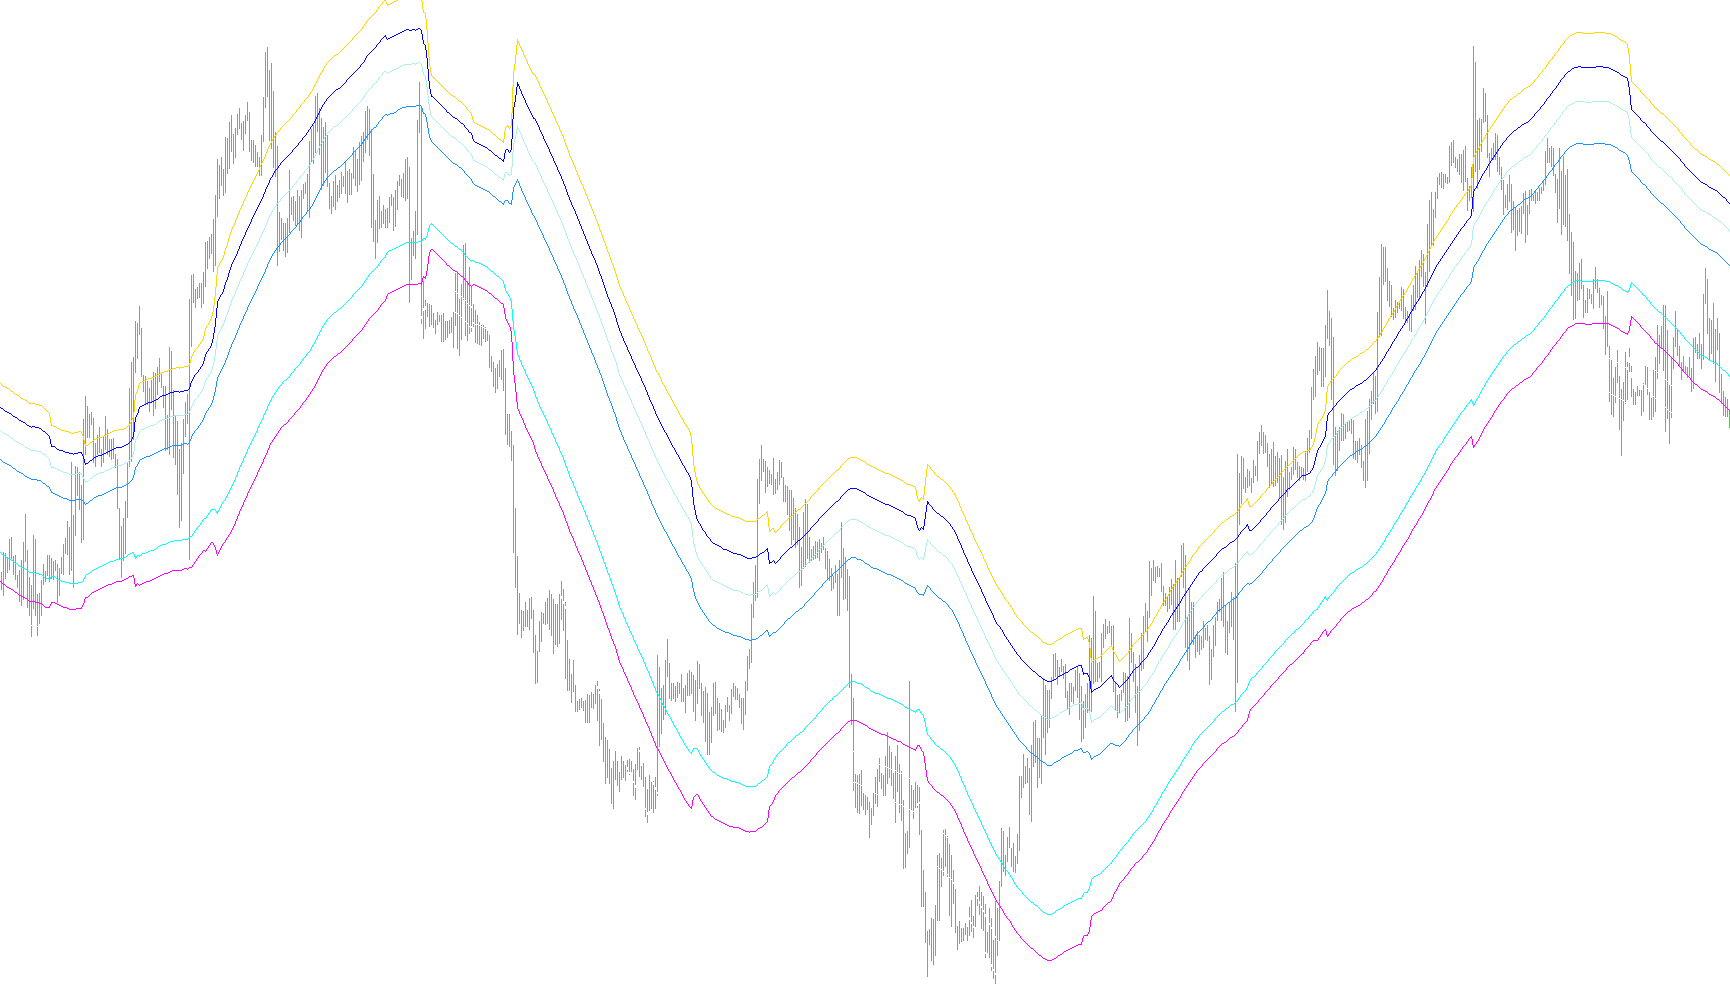
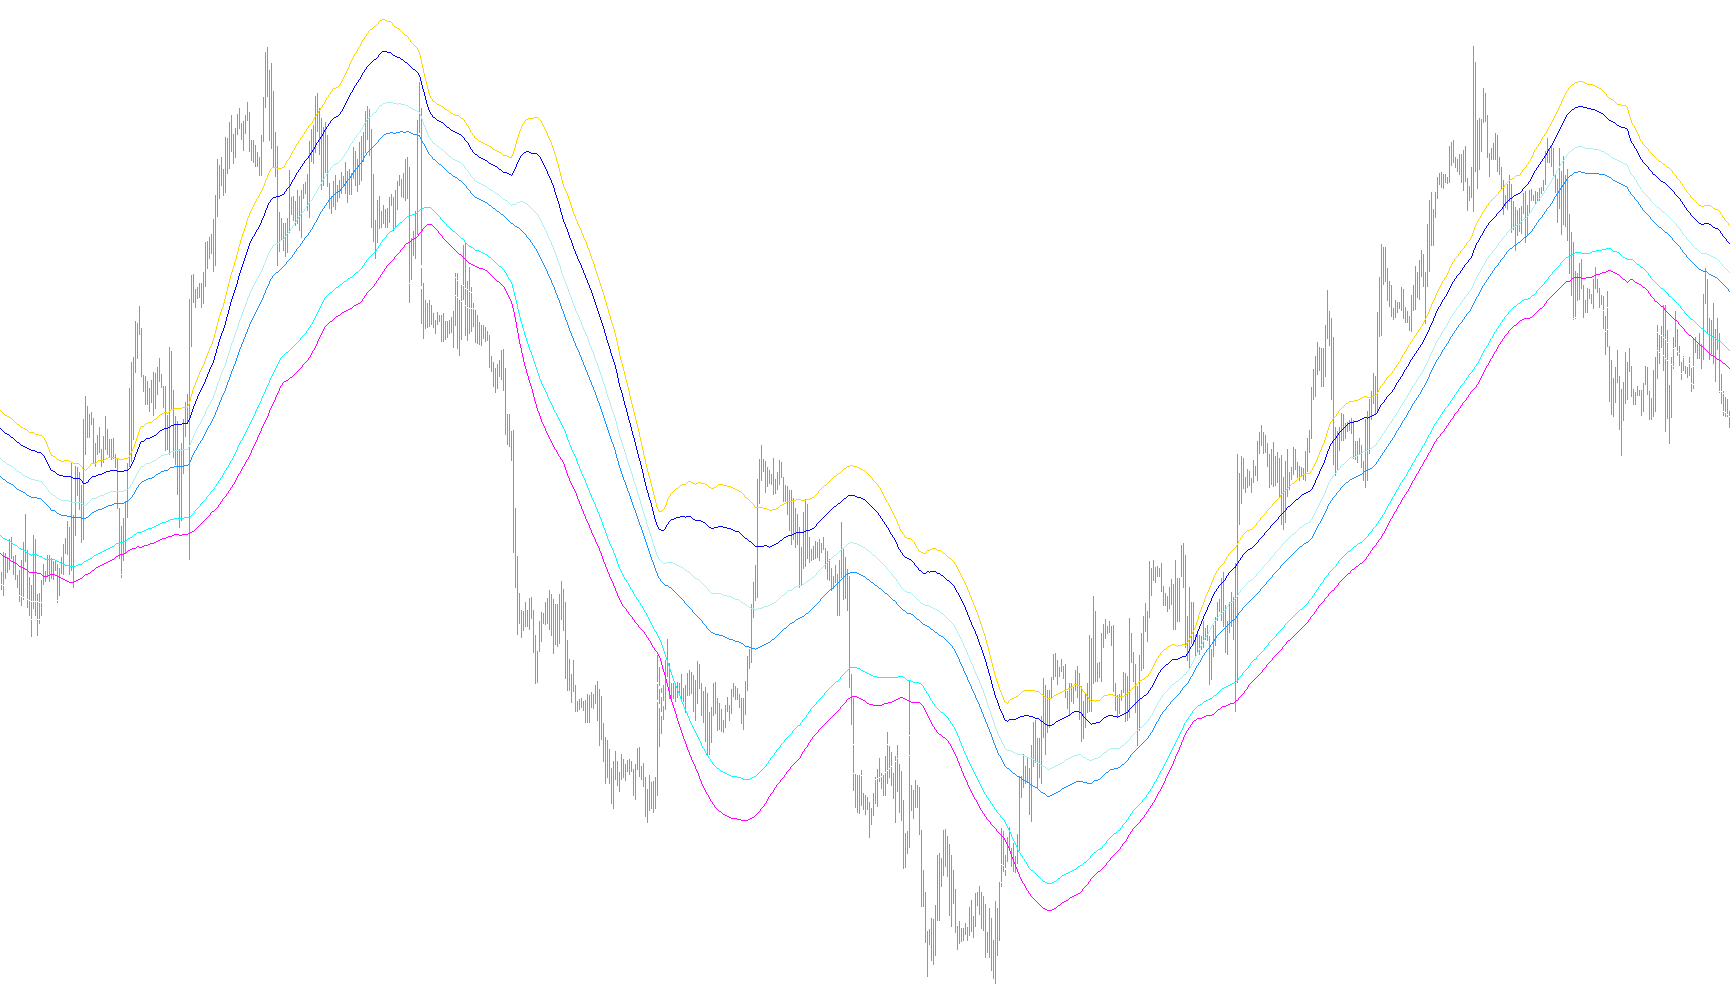
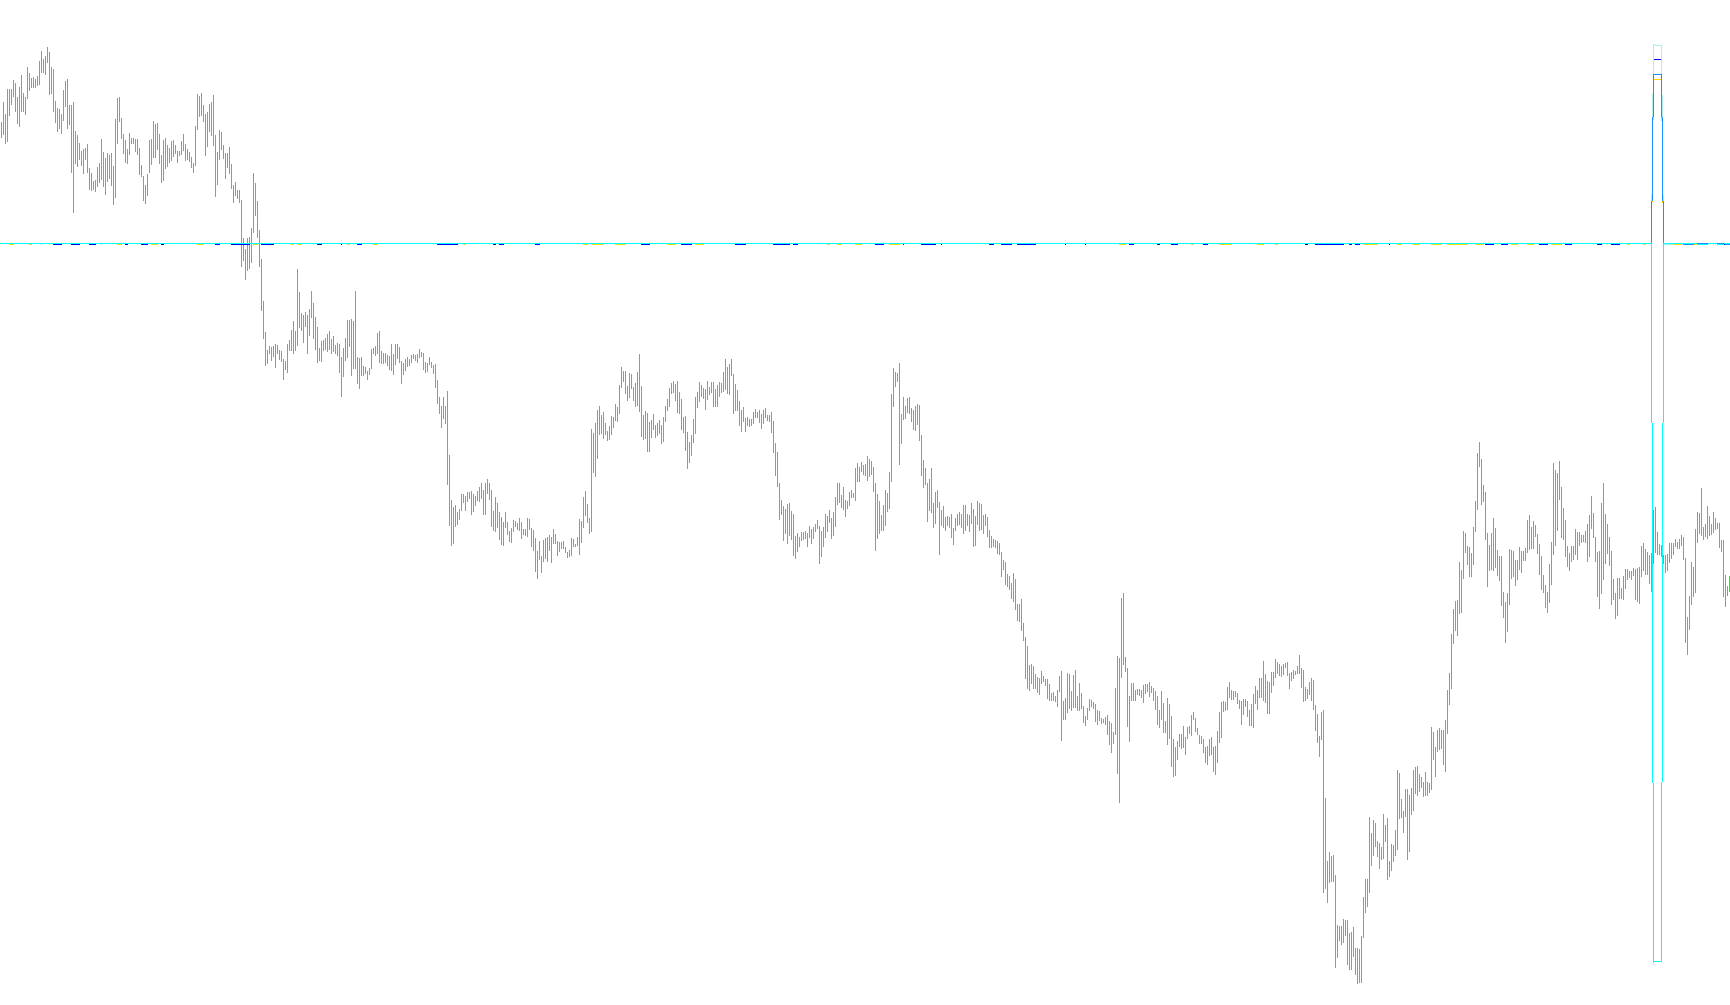
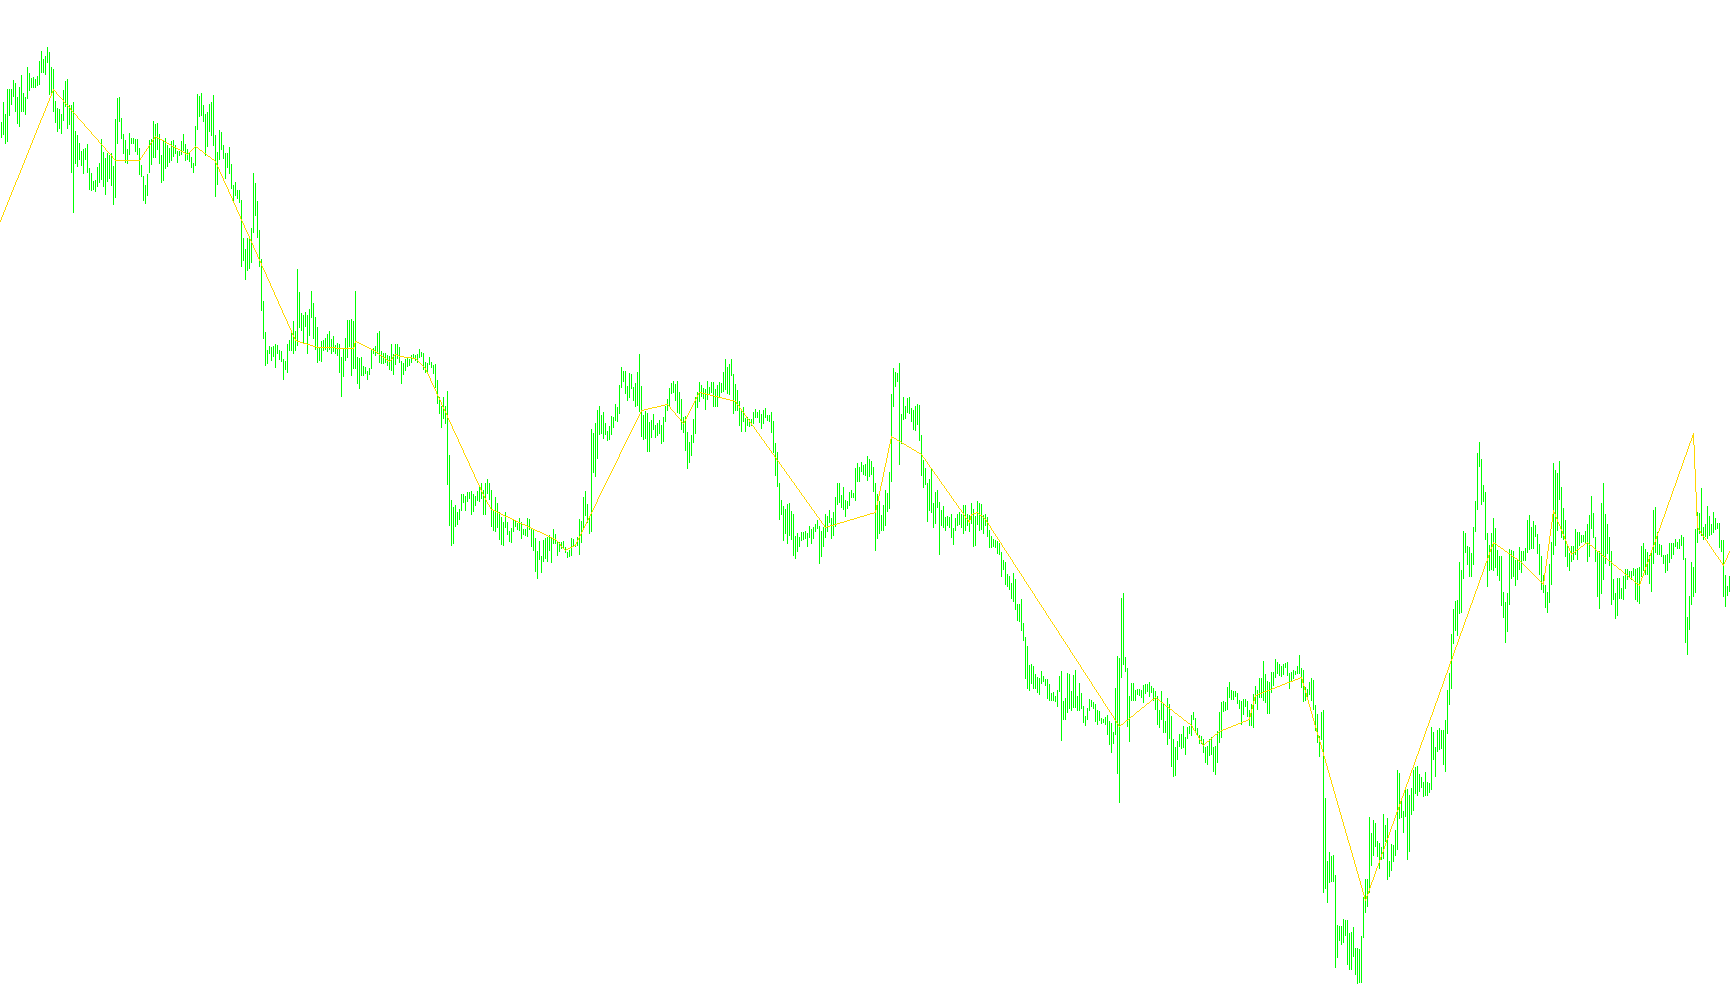
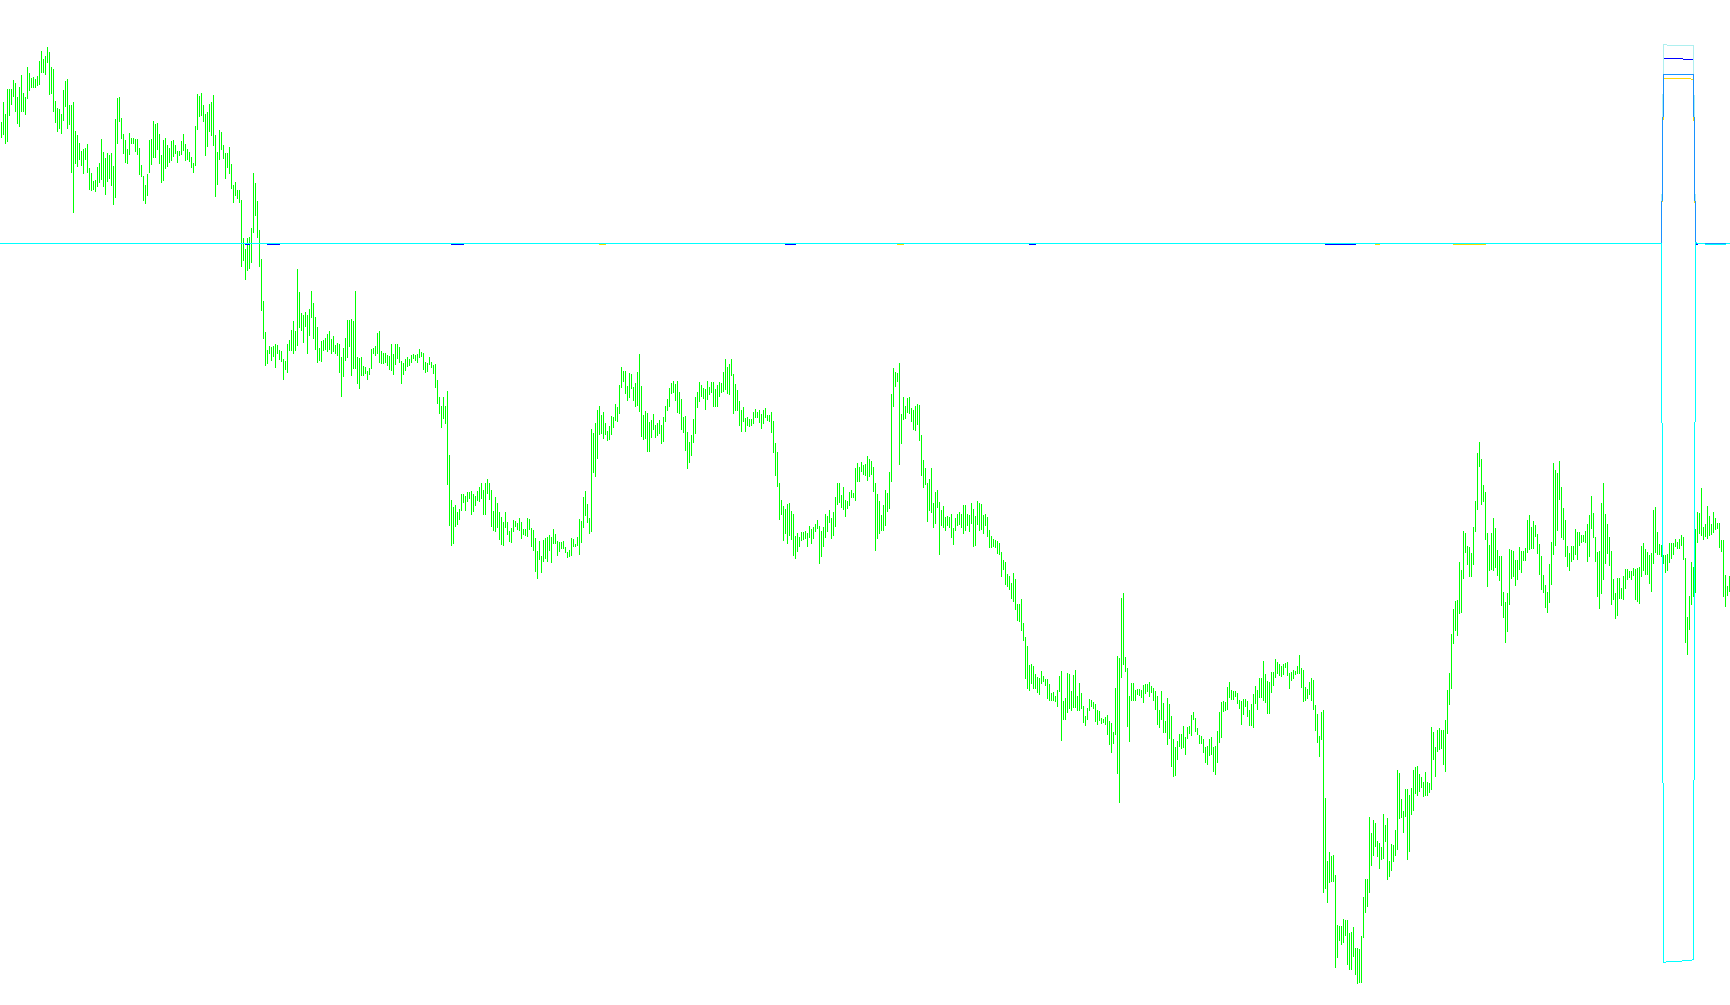
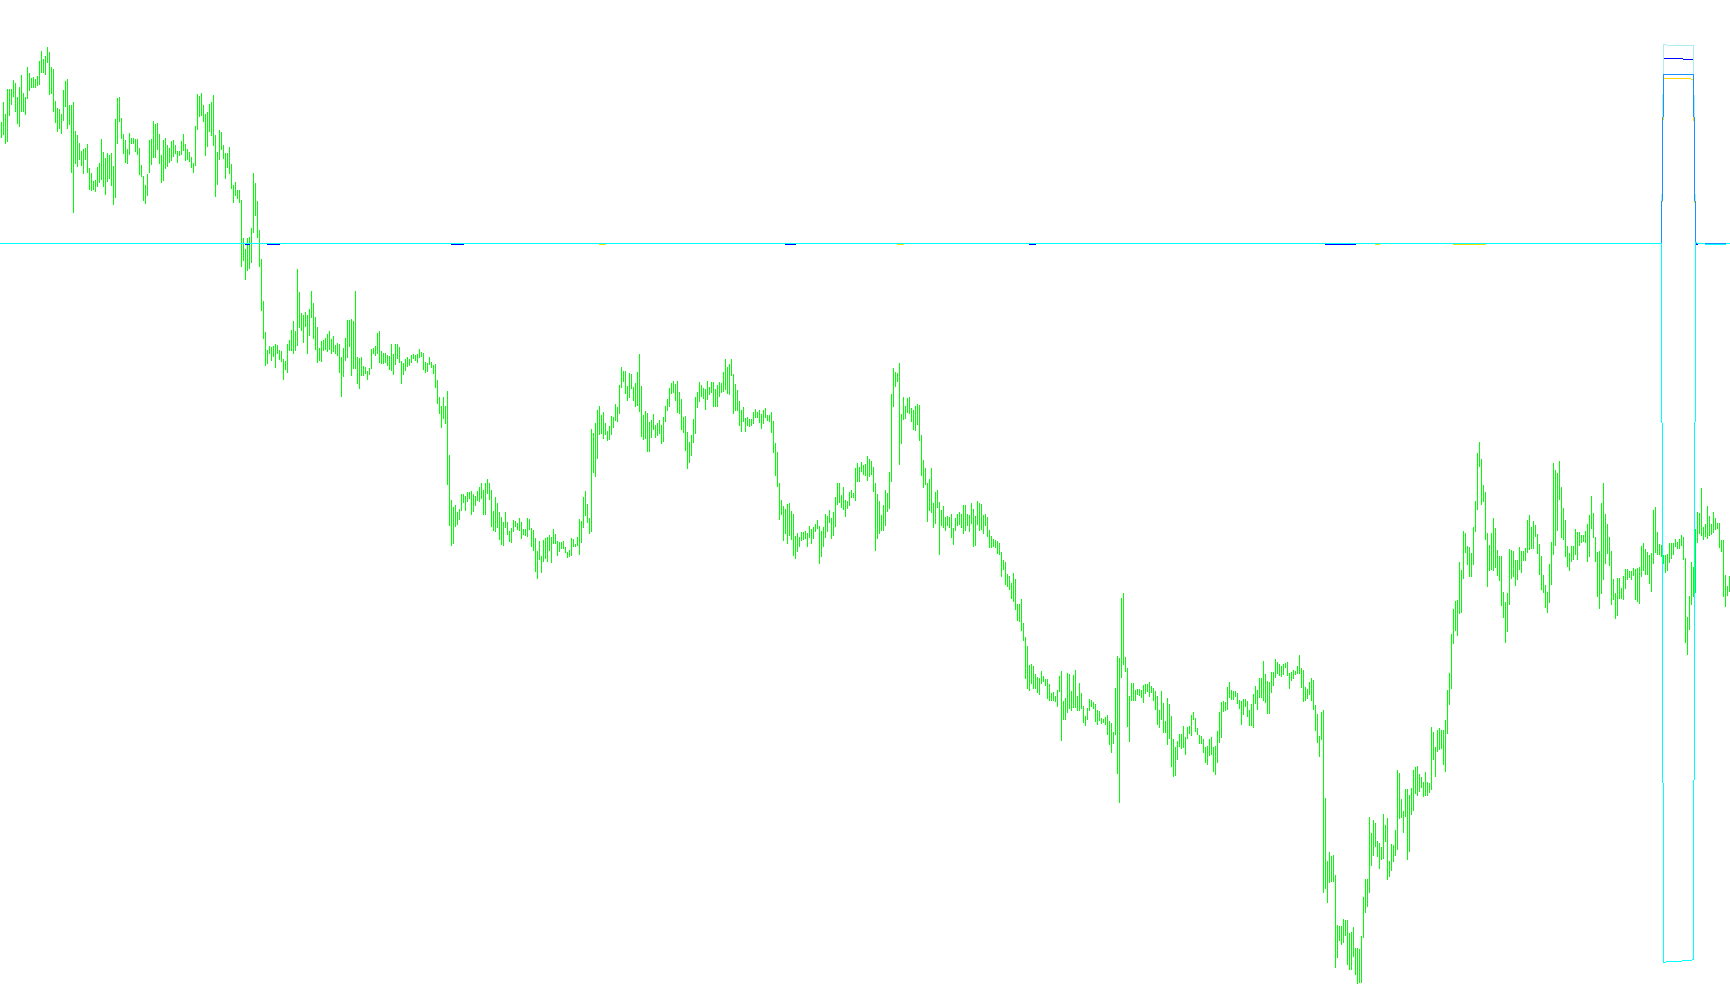
channelsfibo_ad
Indicator

channelsfibo_ad

iMA

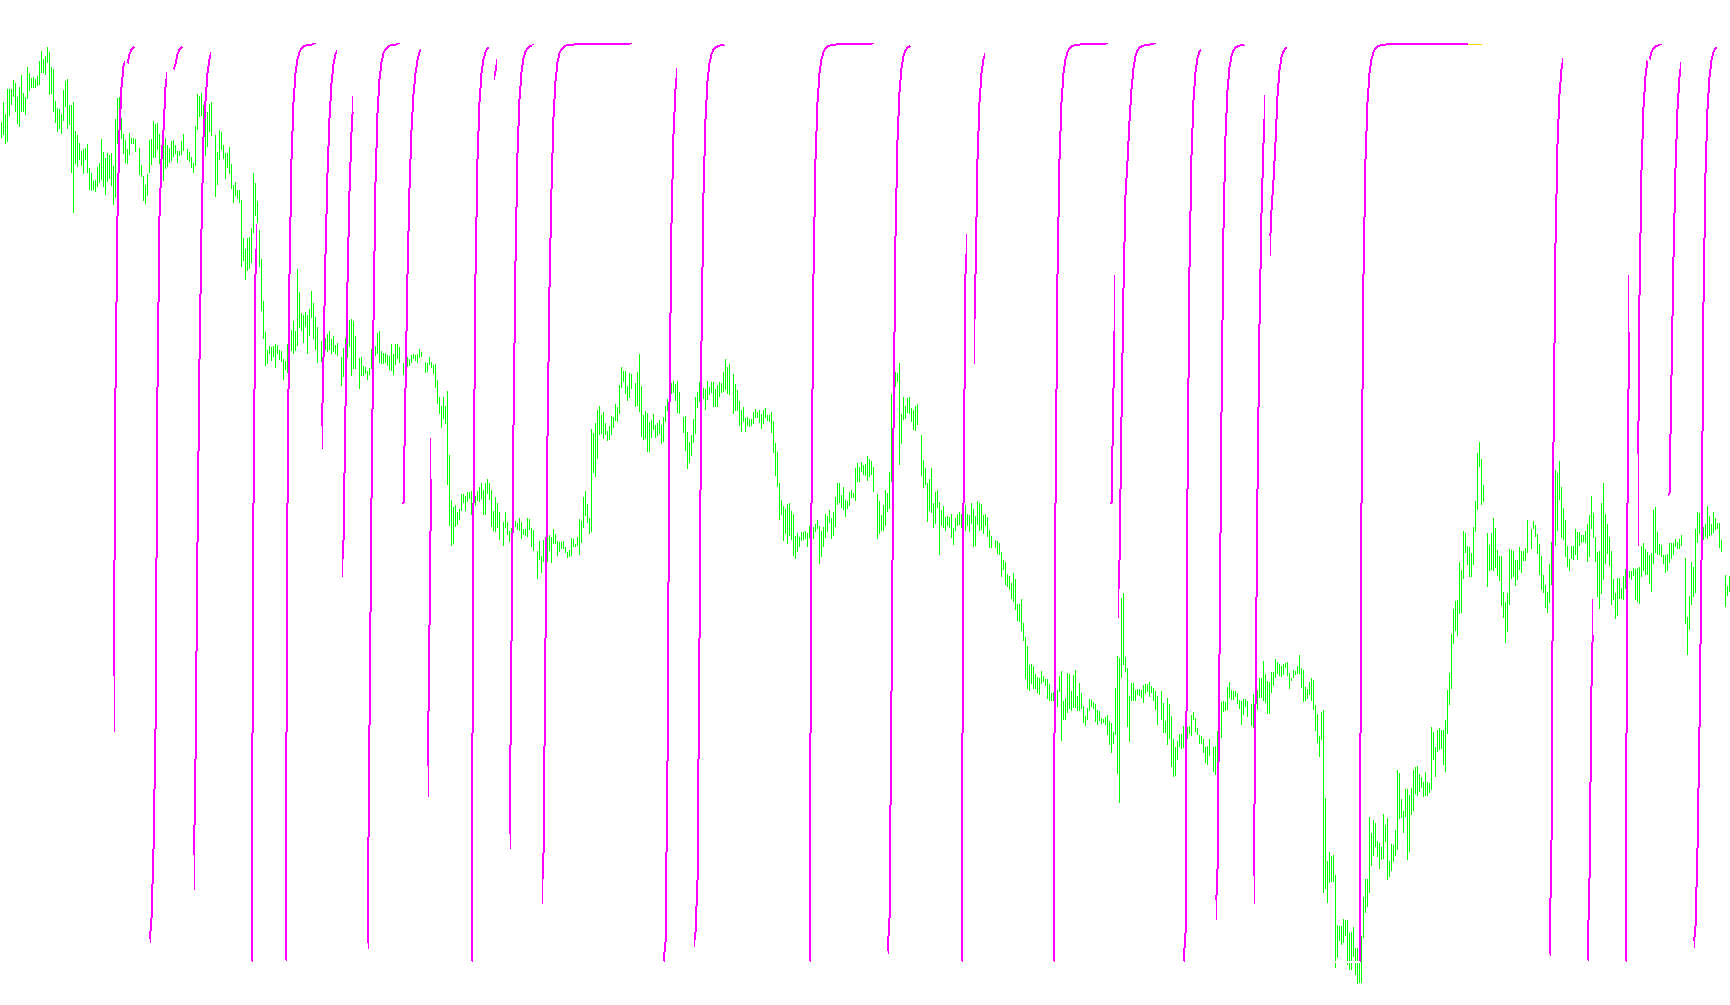
This indicator projects Fibonacci-based price boundaries derived from the maximum historical volatility between price action and a moving average.

channelsfibo_mtf_ad
Indicator

channelsfibo_mtf_ad

iMA

This indicator dynamically constructs a multi-timeframe price corridor by projecting Fibonacci retracement levels from the maximum historical deviation between price and a moving average.

channelsfibo_v2_ad
Indicator

channelsfibo_v2_ad

iMA

This indicator generates a multi-layered price channel by calculating the statistical deviation or distance between current price action and a moving average to project Fibonacci-based expansion zones.

channelsfibo_v2_mtf_ad
Indicator

channelsfibo_v2_mtf_ad

iMA

This indicator generates a dynamic trading channel by calculating the maximum price deviation from a moving average and projecting customized Fibonacci levels across multiple timeframes.

Channel_ZZ
Indicator

Channel_ZZ

iMA

This indicator identifies structural trend shifts by tracking extrapolated price extremes and projecting a parallel buffer zone based on volatility-sensitive geometric expansion.

CheckMarkPattern_AD
Indicator

CheckMarkPattern_AD

iMACDiMomentumiRVIiRSI

This indicator identifies bullish and bearish patterns by detecting inverse price-to-oscillator extremums across multiple technical metrics.

Close-Low
Indicator

Close-Low

iMA

This indicator calculates a relative distance metric by dividing the current candle's high by the low price from a fixed historical offset.

close_-_ema_20
Indicator

close_-_ema_20

iMA

This indicator projects exponential moving averages from multiple timeframes onto the current chart, dynamically changing colors based on price position relative to each level.
CMA
Indicator

CMA

iMAiStdDev

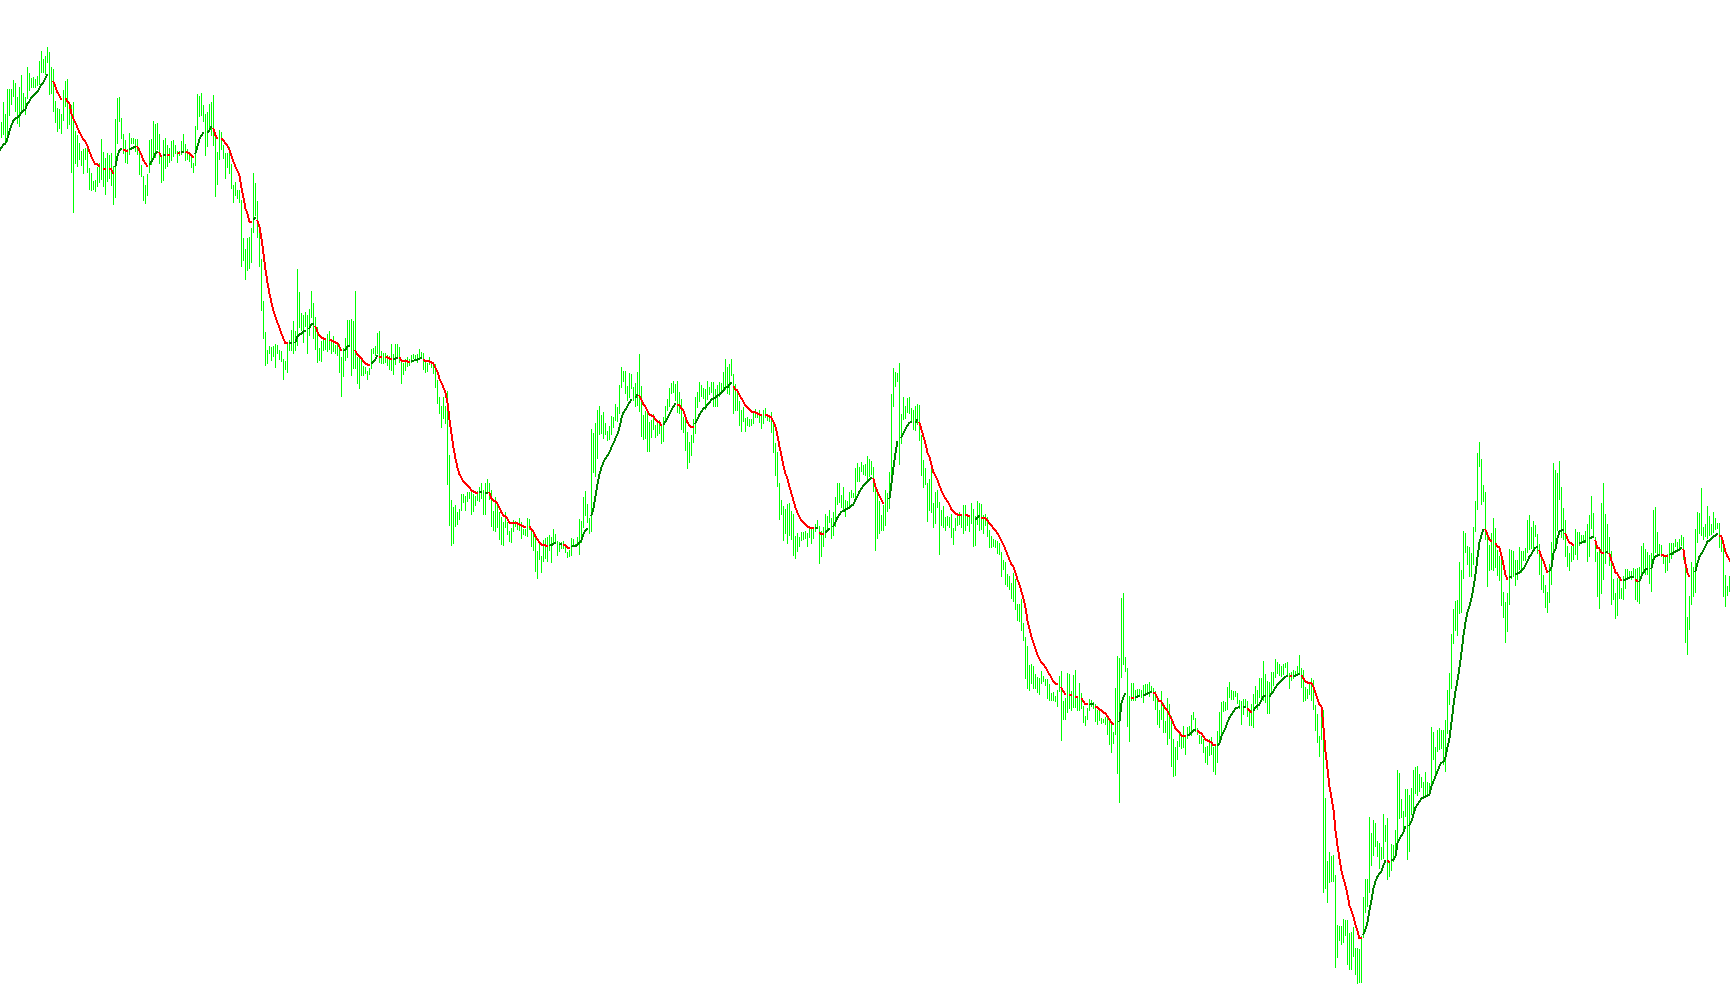
The algorithm utilizes a modified Kaufman Adaptive Moving Average logic by scaling price movement influence based on the ratio between current volatility and absolute deviation.

CMO_v1
Indicator

CMO_v1

iMAiMAOnArray

This indicator quantizes market momentum by calculating the percentage difference between cumulative bullish and bearish price velocity over a specified period.

CMO_v1_001
Indicator

CMO_v1_001

iMAiMAOnArray

This indicator quantifies market sentiment by calculating the relative proportion of upward price movements against downward price movements over a specific period.

CMO_v1_v1
Indicator

CMO_v1_v1

iMAiMAOnArray

Quantifies the net cumulative pressure of bulls versus bears by calculating the percentage ratio of positive to negative price movements over a specified lookback period.

CMO_v1_v2
Indicator

CMO_v1_v2

iMAiMAOnArray

This indicator quantifies market sentiment by calculating the relative percentage of bullish versus bearish price movements over a specific lookback period.

CoeffofLine
Indicator

CoeffofLine

iMA

Calculates the logarithmic ratio between a weighted price average and a smoothed moving average to identify momentum shifts across major currency pairs.

CoeffofLineAlert
Indicator

CoeffofLineAlert

iMA

The algorithm calculates a logarithmic ratio between a weighted price median and a smoothed moving average to identify directional momentum shifts.

CoeffofLine_true
Indicator

CoeffofLine_true

iMA

The algorithm calculates the logarithmic ratio between price-weighted averages and smoothed moving averages to identify structural volatility discrepancies.

CoeffofLine_true2
Indicator

CoeffofLine_true2

iMA

Calculates the logarithmic ratio between weighted price median averages and smoothed moving average components to quantify structural volatility.

CoeffofLine_trueEdit
Indicator

CoeffofLine_trueEdit

iMA

This indicator calculates the logarithmic ratio between a weighted price median and a smoothed moving average to identify trend momentum reversals.

CoeffofLine_true_v1
Indicator

CoeffofLine_true_v1

iMA

This indicator quantifies the logarithmic variance between a weighted average of median prices and a smoothed moving average to detect overextended market momentum.

CoeffofLine_v1
Indicator

CoeffofLine_v1

iMA

Calculates the logarithmic ratio between weighted price averages and smoothed moving averages to identify momentum disparities across specific currency pairs.

CoeffofLine_v1_v1
Indicator

CoeffofLine_v1_v1

iMA

The logic calculates the logarithmic ratio between weighted median price averages and smoothed moving average aggregates to identify relative volatility shifts.

CoeffofLine_v1_v2
Indicator

CoeffofLine_v1_v2

iMA

Calculates the logarithmic variance between weighted price medians and smoothed moving averages to identify momentum divergence.

CoeffofLine_v2
Indicator

CoeffofLine_v2

iMA

This indicator calculates the logarithmic ratio between weighted price medians and smoothed moving averages to identify structural equilibrium shifts.

CoeffoLine_fixed
Indicator

CoeffoLine_fixed

iMA

Calculates the logarithmic ratio between weighted price midpoints and smoothed moving averages to identify momentum asymmetries.

CoeffoLine_Hist
Indicator

CoeffoLine_Hist

iMA

This indicator calculates the logarithmic ratio between price-weighted moving averages and smoothed median averages to identify underlying structural momentum.

CoeffoLine_Hist1
Indicator

CoeffoLine_Hist1

iMA

The algorithm calculates the logarithmic ratio between weighted price midpoints and smoothed moving averages to identify statistical deviations from equilibrium.

CoeffoLine_Hist1_v1
Indicator

CoeffoLine_Hist1_v1

iMA

The indicator computes the logarithmic ratio between weighted price midpoints and smoothed moving average deviations to identify momentum asymmetries.

CoeffoLine_Hist2
Indicator

CoeffoLine_Hist2

iMA

The indicator calculates a logarithmic ratio between weighted price averages and smoothed median moving averages to identify momentum shifts.

CoeffoLine_Hist_001
Indicator

CoeffoLine_Hist_001

iMA

The indicator calculates the logarithmic ratio between weighted price midpoints and smoothed median moving averages to highlight divergence in volatility structures.

CoeffoLine_Hist_v1
Indicator

CoeffoLine_Hist_v1

iMA

This indicator calculates the logarithmic ratio between weighted price medians and smoothed moving average components to identify structural volatility deviations.

CoeffoLine_Hist_v2
Indicator

CoeffoLine_Hist_v2

iMA

The script calculates a normalized logarithmic ratio between price-weighted linear moving averages and smoothed median moving averages to highlight structural momentum shifts.

Coffie_v1
Indicator

Coffie_v1

iMA

This indicator calculates the logarithmic ratio between weighted price averages and smoothed median moving averages to identify structural momentum shifts.

Color Moving average
Indicator

Color Moving average

iMA

This indicator dynamically updates a moving average line color to visualize trend direction by detecting changes in price momentum relative to historical averages.

Colored Schaff Trend
Indicator

Colored Schaff Trend

iMA

This indicator synthesizes a nested momentum logic by sequentially applying stochastic smoothing to the differences of exponential moving averages.

ColorOsMA
Indicator

ColorOsMA

iMAiMAOnArray

This indicator visualizes the spread between the MACD line and its signal average using a dual-colored histogram to highlight positive and negative momentum shifts.

ColorOsMA_v1
Indicator

ColorOsMA_v1

iMAiMAOnArray

This indicator quantifies price momentum by calculating the differential between a primary MACD line and its signal average, rendered as a dual-color histogram.

ColorOsMA_v2
Indicator

ColorOsMA_v2

iMAiMAOnArray

This indicator quantifies momentum by calculating the difference between the MACD line and its signal line, visually bifurcating positive and negative deviations into distinct colored histograms.

ColorOsMA_v3
Indicator

ColorOsMA_v3

iMAiMAOnArray

This indicator quantifies price momentum by calculating the differential between the MACD line and its signal average, visualized as a color-coded histogram to identify directional shifts.

Color_MA
Indicator

Color_MA

iMA

This indicator visualizes momentum by dynamically shifting color states based on the incremental direction of an Exponential Moving Average.

Combined_MA_Signal
Indicator

Combined_MA_Signal

iMA

The logic calculates a weighted moving average of price differences to identify directional shifts and generates trend-following signals based on momentum acceleration.

Complex'
Indicator

Complex'

iMA

This indicator calculates the relative momentum of major fiat currencies by aggregating weighted moving average differentials across a cross-pair matrix.

Complex'_001
Indicator

Complex'_001

iMA

This indicator calculates the relative strength and directional momentum of major currencies by aggregating smoothed moving average differentials across multiple currency pairs simultaneously.

Complex
Indicator

Complex

iMA

The indicator calculates the weighted directional strength of major currencies by aggregating the differences between short and long Moving Averages across multiple currency pairs.

Complex_balance
Indicator

Complex_balance

iMA

This indicator calculates synthetic price deviations by aggregating weighted Moving Average differentials across multiple currency pairs to identify cross-market momentum shifts.

Complex_balance____Ext
Indicator

Complex_balance____Ext

iMA

This indicator identifies trend reversals by calculating the variance between two moving averages and projecting volatility adjustments onto a price-weighted central mean.

Complex_Common
Indicator

Complex_Common

iMA

This indicator calculates the weighted price velocity of five major currencies by computing the differential between dual moving averages across multiple currency pairs.

Complex_Common_Frames
Indicator

Complex_Common_Frames

iMA

This indicator quantifies the relative strength of major currencies by calculating the weighted sum of linear weighted moving average (LWMA) deviations across various currency pairs simultaneously.

Complex_Common_v1
Indicator

Complex_Common_v1

iMA

This indicator calculates and visualizes the aggregate deviation between dual moving averages across multiple currency pairs to identify relative strength and cross-market momentum.

Complex_Common_v2
Indicator

Complex_Common_v2

iMA

This indicator calculates the relative strength of major global currencies (USD, EUR, GBP, CHF, JPY) by aggregating weighted Moving Average deviations across a comprehensive cross-pair matrix.

Complex_Common__(bez linii)
Indicator

Complex_Common__(bez linii)

iMA

This indicator calculates the weighted price action divergence between major global currencies by aggregating moving average spreads across multiple currency pairs simultaneously.