Indicator

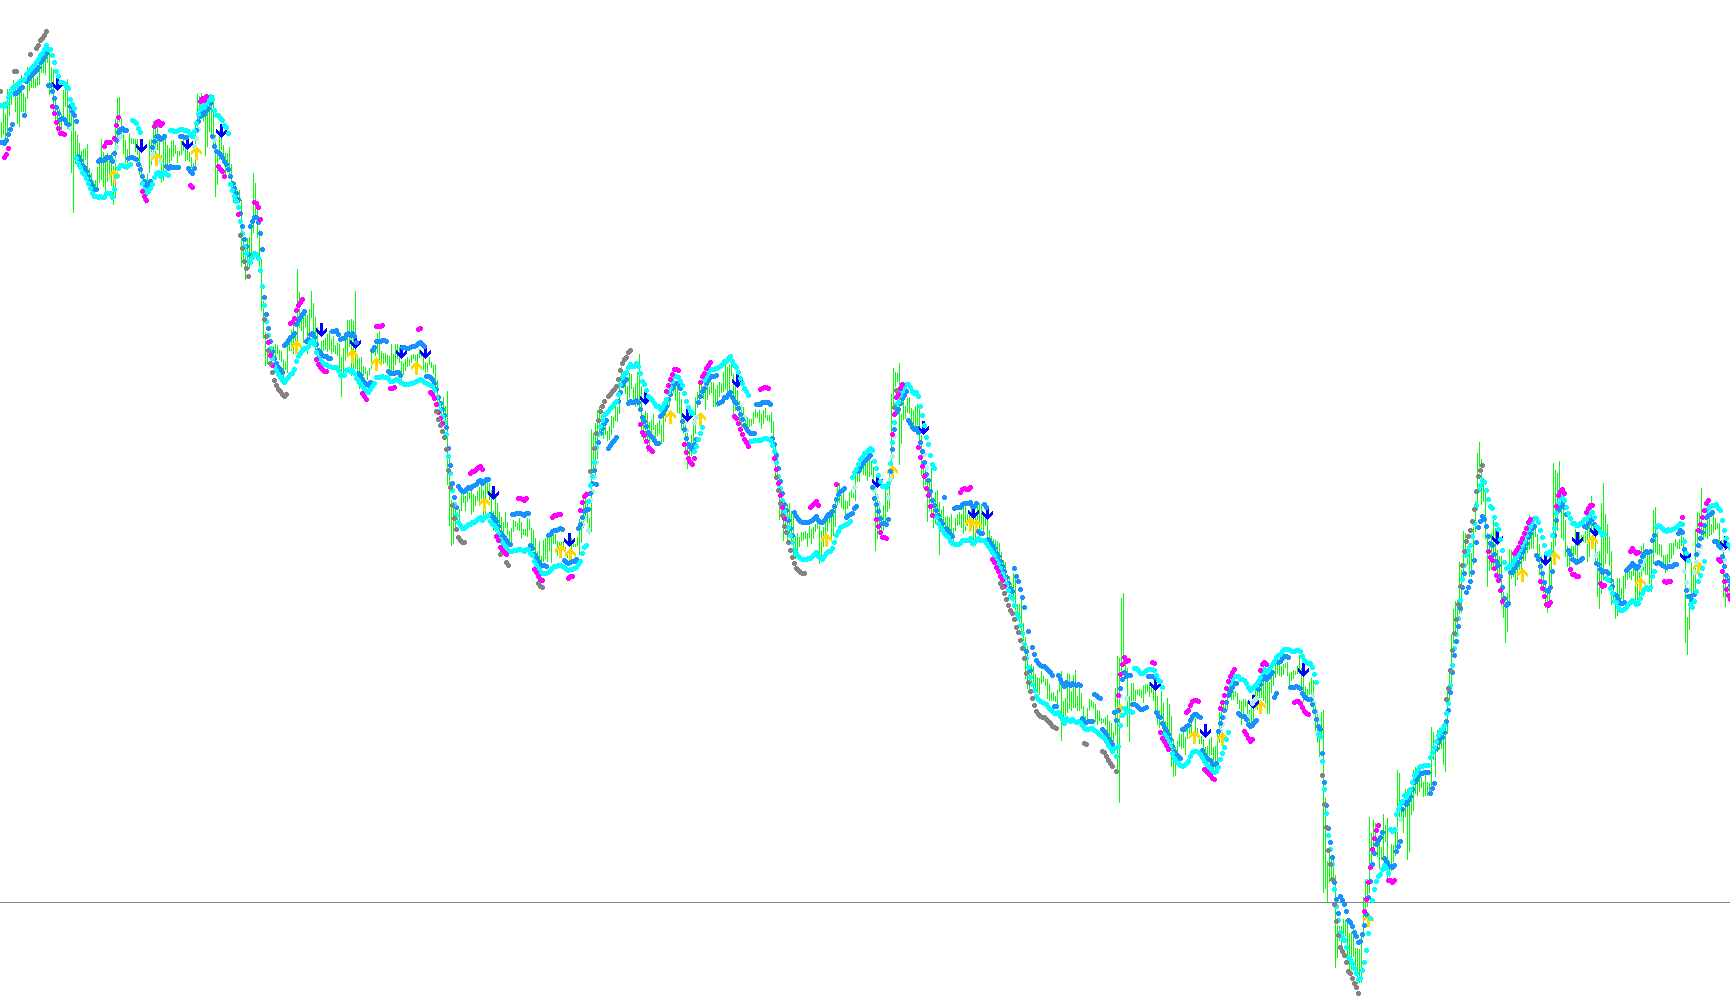
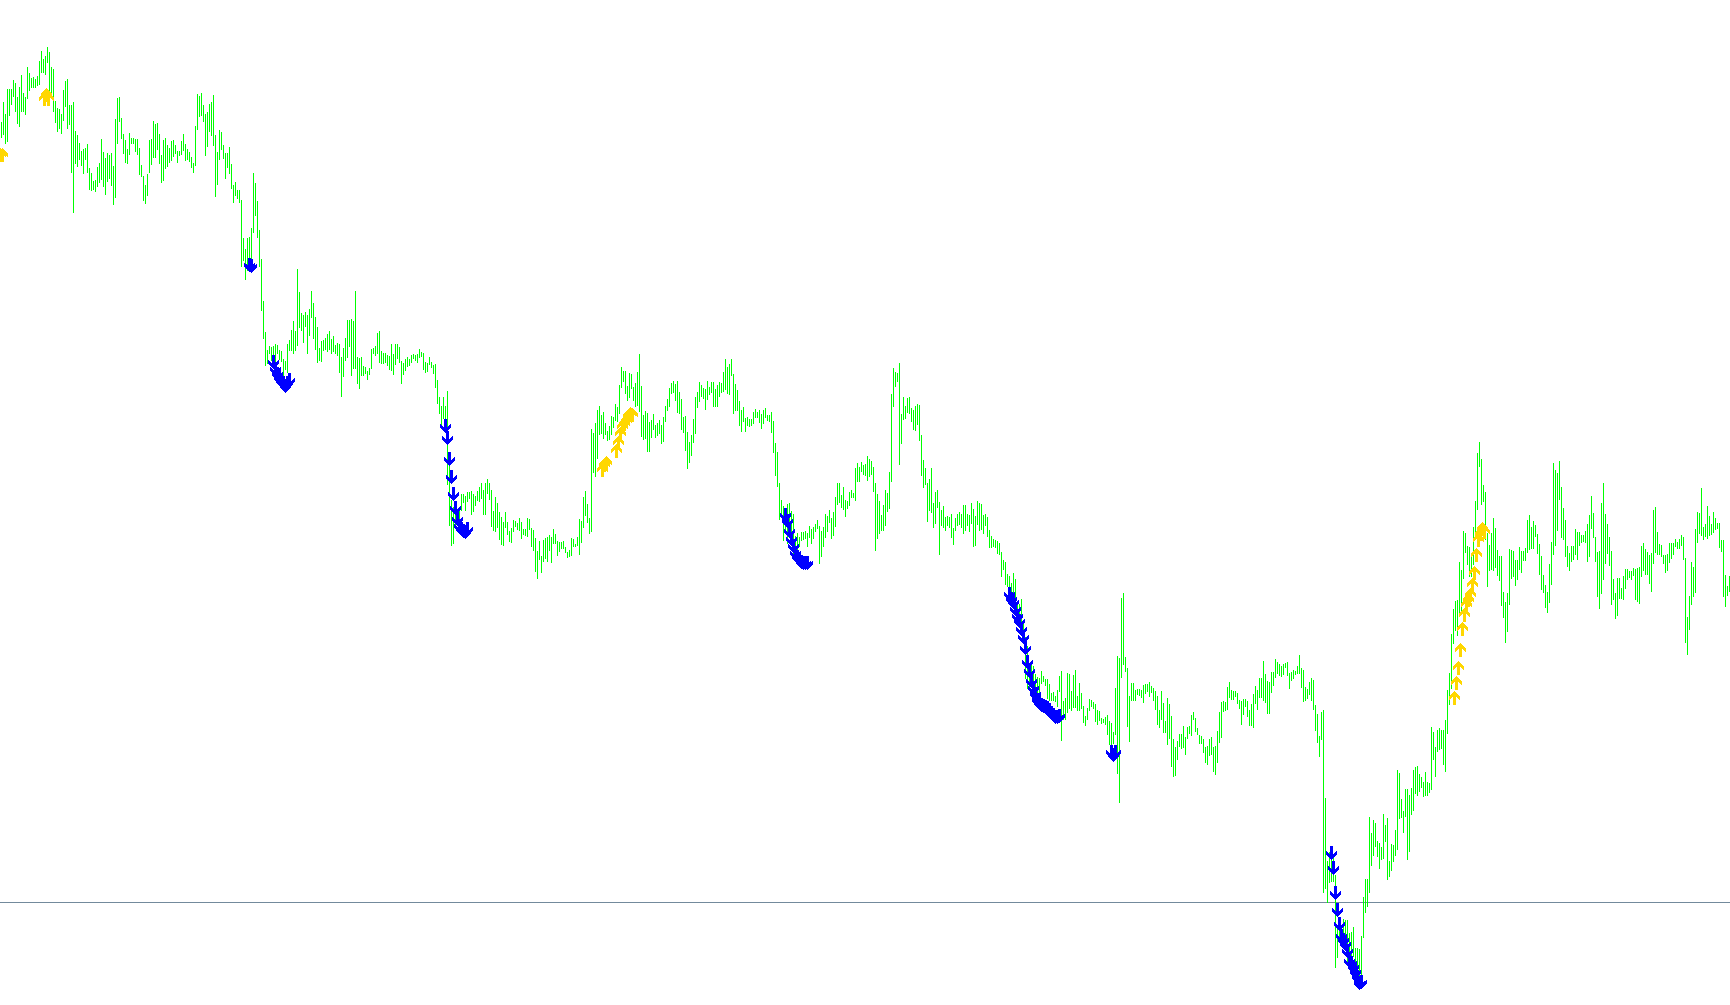
Sidus_Bago_GS_2011_04_14

iMAiRSI
Indicator

RSISignal

iATRiMAOnArrayiRSI
Indicator

BBands for RSI.1.1

iRSI
Indicator

RSI_MA_v1.2

iMAiRSI
Indicator

RSI with channels

iRSI
Indicator

LP_entry

iWPRiRSI
Indicator

eXclusive_MTF_RSI

iRSI
!
Indicator

!

iMAOnArrayiRSI
!_v0.10
Indicator

!_v0.10

iMAOnArrayiRSI
Indicator

##MTF_RSI

iRSI
#Kino_CCI_RSI_v5
Indicator

#Kino_CCI_RSI_v5

iCCIiRSI

This indicator identifies bullish and bearish momentum shifts by synchronizing dual Commodity Channel Index (CCI) zero-line crossovers with high-velocity Relative Strength Index (RSI) thresholds.

#MarketPrice _v1_4
Indicator

#MarketPrice _v1_4

iCCIiMAiRSIiStochastic
Indicator

#MTF_RSI

iRSI
Indicator

#MTF_RSI2

iRSI
Indicator

#MTF_RSI_v1

iRSI
Indicator

#MTF_RSI_v2

iRSI
#RSI-3TF
Indicator

#RSI-3TF

iRSI

This indicator overlays and synchronizes Relative Strength Index values across three distinct timeframes onto a single visual window to identify multi-horizon momentum trends.

#WSS943!INDICATOR-6
Indicator

#WSS943!INDICATOR-6

iMACDiADXiMAiRSI
(3) TEST_BARS_GBPJPY_8v1_Low
Indicator

(3) TEST_BARS_GBPJPY_8v1_Low

iWPRiMomentumiRSIiStochastic
(3) TEST_BARS_GBPJPY_8v1_Low_en
Indicator

(3) TEST_BARS_GBPJPY_8v1_Low_en

iWPRiMomentumiRSIiStochastic
+RSI-TC
Indicator

+RSI-TC

iBandsiATRiMAiRSI
+RSI-TC_v2
Indicator

+RSI-TC_v2

iBandsiATRiMAiRSI
+RSI_mtf
Indicator

+RSI_mtf

iRSI

This indicator calculates the difference between two Relative Strength Index values across different timeframes to identify momentum shifts and directional trend changes.

-RSI-3TF
Indicator

-RSI-3TF

iRSI

This indicator synchronizes Relative Strength Index data across three distinct timeframes to identify multi-layer momentum trends and potential divergence.

0-0-TANGO
Indicator

0-0-TANGO

iRSI

The algorithm identifies bullish and bearish price action by detecting specific discrepancies between historical price movements and Relative Strength Index (RSI) extremes within a defined lookback window.

0_MoR2a
Indicator

0_MoR2a

iMAOnArrayiRSI

This indicator calculates a momentum ratio by dividing the short-term moving average of an RSI value by its long-term counterpart to identify trend intensity and divergence.

0_MoR2a_001
Indicator

0_MoR2a_001

iMAOnArrayiRSI

This indicator calculates the percentage deviation between two moving averages derived specifically from RSI data to identify momentum shifts.

0_MoR3_mtf
Indicator

0_MoR3_mtf

iMAOnArrayiRSI

This indicator analyzes momentum dynamics by calculating the relative percentage ratio between two moving averages applied specifically to the RSI oscillator across multiple timeframes.

10Min_01
Indicator

10Min_01

iMACDiMAiRSIiStochastic

Identifies market inflection points by detecting momentum crossovers between weighted and simple moving averages across multiple oscillators.

10Min_011
Indicator

10Min_011

iMACDiMAiRSIiStochastic

This indicator identifies trend reversals by detecting Weighted Moving Average crossovers synchronized with Stochastic, RSI, and MACD momentum filters.

10Min_011a
Indicator

10Min_011a

iMACDiMAiRSIiStochastic

This indicator identifies high-probability trade entries by synthesizing weighted moving average crossovers, RSI momentum shifts, and stochastic oscillator divergences.

10Min_011a_v1
Indicator

10Min_011a_v1

iMACDiMAiRSIiStochastic

This indicator identifies bullish and bearish entries by synchronizing moving average crossovers with RSI volatility thresholds, Stochastic momentum spreads, and MACD signal polarity.

10Min_011a_v2
Indicator

10Min_011a_v2

iMACDiMAiRSIiStochastic

This indicator identifies high-probability entry points by synchronizing Weighted/Simple Moving Average crossovers with RSI momentum shifts, MACD trend positioning, and Stochastic oscillator extremes.

10Min_011_v1
Indicator

10Min_011_v1

iMACDiMAiRSIiStochastic

This indicator identifies high-probability trend reversals by synchronizing weighted moving average crossovers with momentum shifts from Stochastic, RSI, and MACD oscillators.

10Min_012
Indicator

10Min_012

iMACDiMAiRSIiStochastic

This indicator identifies trend reversal points by synchronizing Weighted Moving Average crossovers with RSI threshold shifts, Stochastic main/signal positioning, and MACD signal line polarity.

10Min_012_v1
Indicator

10Min_012_v1

iMACDiMAiRSIiStochastic

This indicator identifies high-probability trend reversals by synchronizing Weighted Moving Average crossovers with RSI momentum shifts, Stochastic oscillator alignment, and MACD signal position.

10Min_01_v1
Indicator

10Min_01_v1

iMACDiMAiRSIiStochastic

Identifies high-probability momentum shifts by detecting the precise intersection of Linear Weighted and Simple Moving Averages.

10Min_2ind
Indicator

10Min_2ind

iMAiRSIiStochastic

This indicator identifies trend reversals by detecting Weighted Moving Average crossovers relative to Simple Moving Averages, filtered through Stochastic momentum shifts and RSI strength thresholds.

10Min_2ind_v1
Indicator

10Min_2ind_v1

iMAiRSIiStochastic

This indicator identifies momentum shifts by detecting Weighted Moving Average crossovers against Simple Moving Averages, filtered through RSI threshold breaches and Stochastic Main/Signal polarity.

10Min_RsiSto_01
Indicator

10Min_RsiSto_01

iMACDiMAiRSIiStochastic

This indicator identifies high-probability reversals by detecting simultaneous extreme overbought and oversold conditions across consecutive RSI and Stochastic oscillators.

10Min_RsiSto_01_v1
Indicator

10Min_RsiSto_01_v1

iMACDiMAiRSIiStochastic

This indicator identifies high-probability reversal zones by detecting sustained RSI overbought/oversold conditions synchronized with extreme Stochastic oscillator thresholds.

2MA_RSI
Indicator

2MA_RSI

iMAOnArrayiRSI

This indicator identifies momentum shifts by applying two distinct moving average crossovers directly onto a multi-timeframe Relative Strength Index base.

2rsi-01
Indicator

2rsi-01

iRSI

Identifies bullish and bearish trend shifts by detecting consecutive increasing or decreasing Relative Strength Index values across a multi-bar lookback period.

2rsi-01_v1
Indicator

2rsi-01_v1

iRSI

Identifies trend shifts by detecting five consecutive incremental rises or falls in the Relative Strength Index values.

3D Oscilator
Indicator

3D Oscilator

iCCIiRSI

This indicator synthesizes Relative Strength Index (RSI), Stochastic behavior, and Commodity Channel Index (CCI) into a smoothed, multi-layered momentum signal for identifying trend exhaustion.

3D Oscilator_v1
Indicator

3D Oscilator_v1

iCCIiRSI

This indicator constructs a multi-layered momentum oscillator by fusing RSI relative strength, Stochastic peak normalization, and CCI tunnel dynamics into a smoothed signal curve.

3D Oscilator_v2
Indicator

3D Oscilator_v2

iCCIiRSI

This indicator synthesizes RSI relative strength, stochastic normalization, and CCI tunnel dynamics into a dual-smoothed multi-dimensional momentum oscillator.

3D_Oscilator
Indicator

3D_Oscilator

iCCIiRSI
3D_Oscilator_v1
Indicator

3D_Oscilator_v1

iCCIiRSI

This indicator synthesizes RSI relative strength, Stochastic momentum, and CCI price deviation into a dual-smoothed signal line to identify trend exhaustion and pivot crossovers.

3in1_ST_RSI_CCI
Indicator

3in1_ST_RSI_CCI

iCCIiMAOnArrayiRSIiStochastic

This indicator synthesizes Stochastic, RSI, and CCI oscillators into a unified momentum stream, applying linear weighting to calculate dual moving average crossovers for trend identification.