Kwan
Indicator

Kwan

iMomentumiMAOnArrayiRSIiStochastic

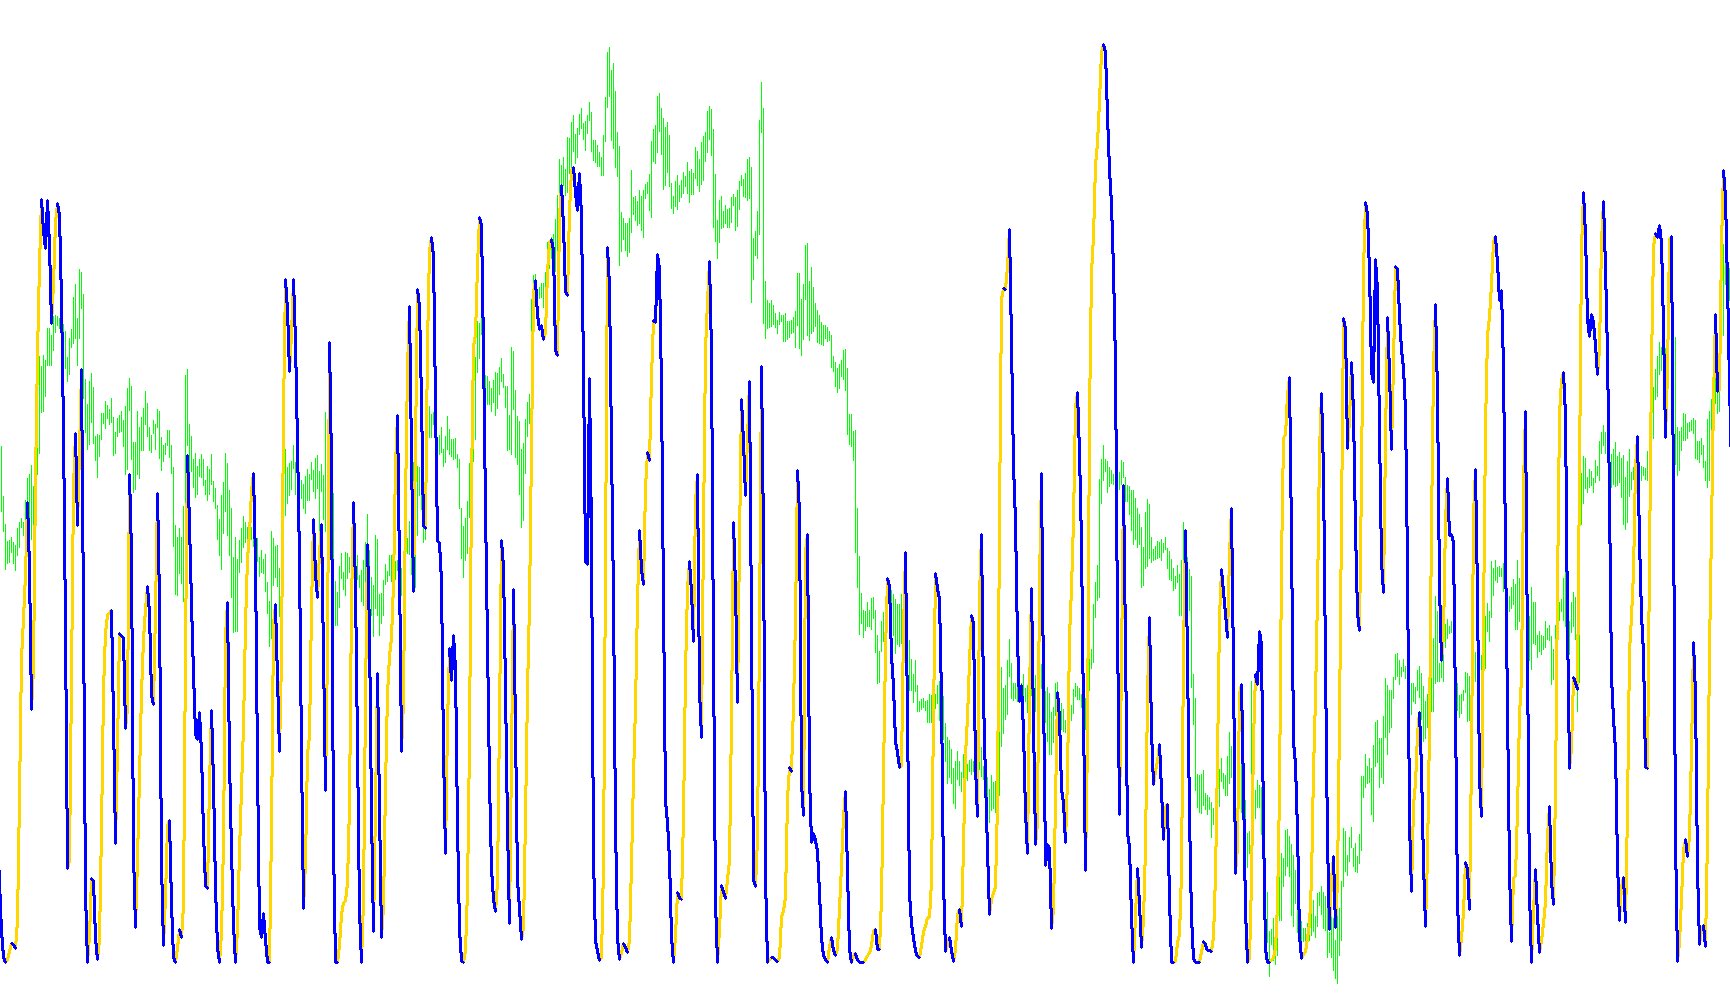
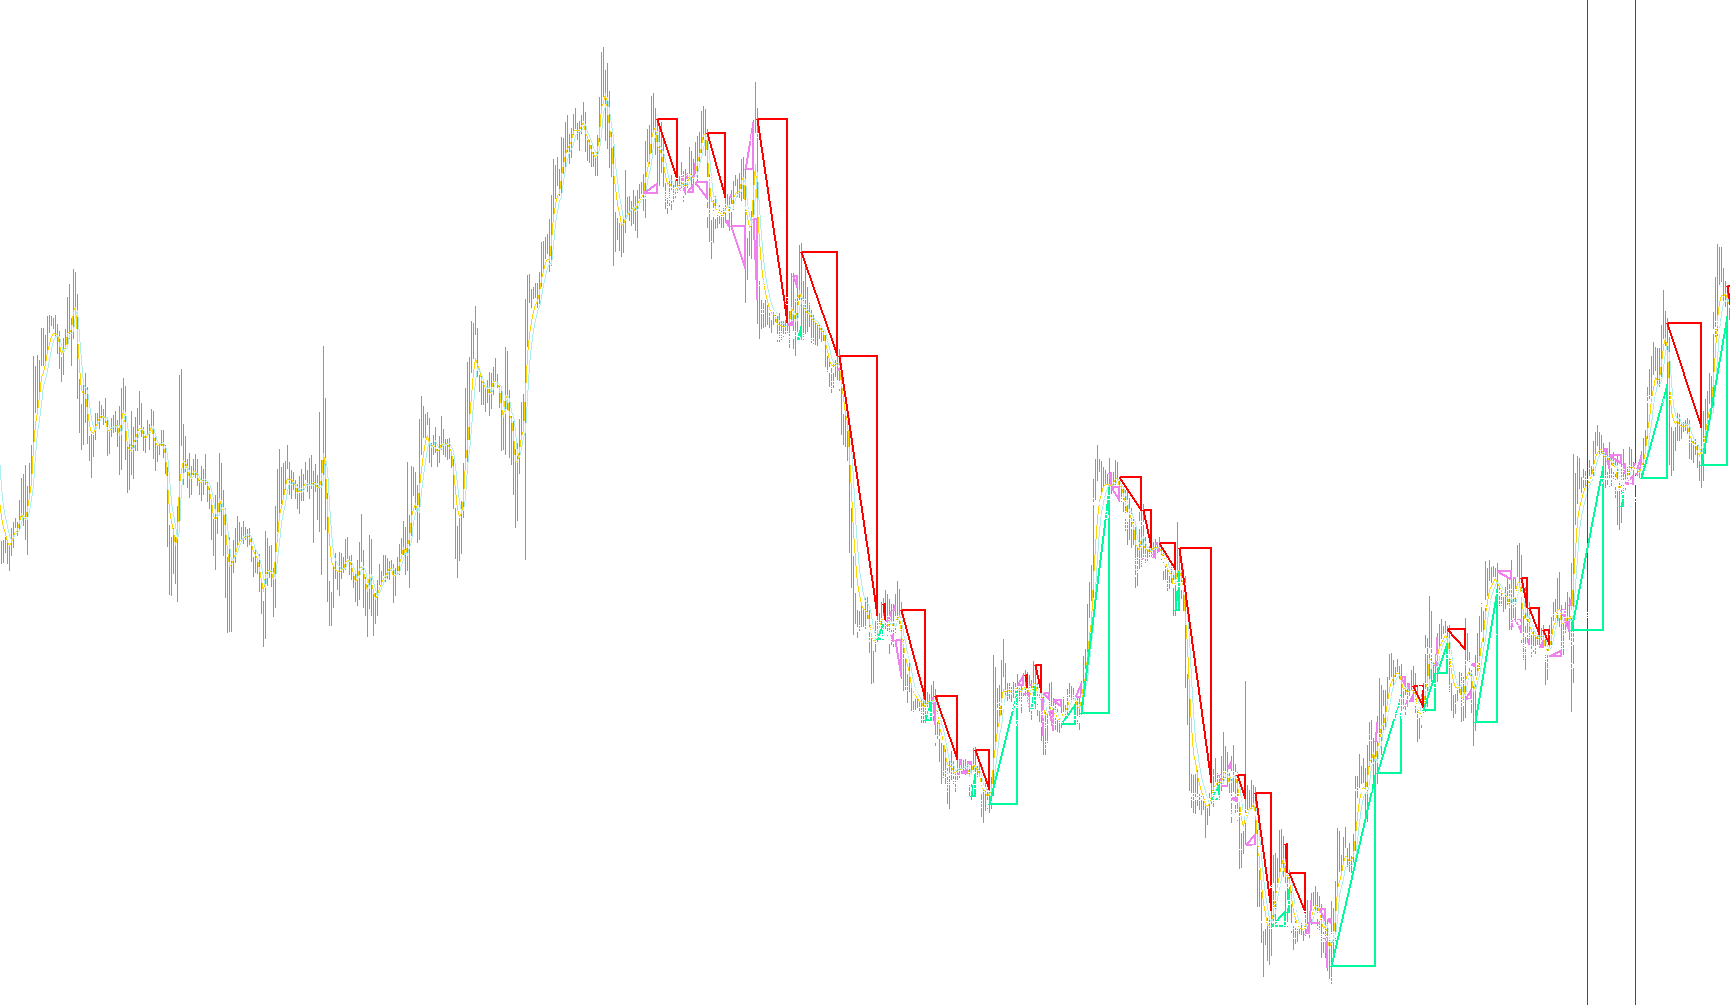
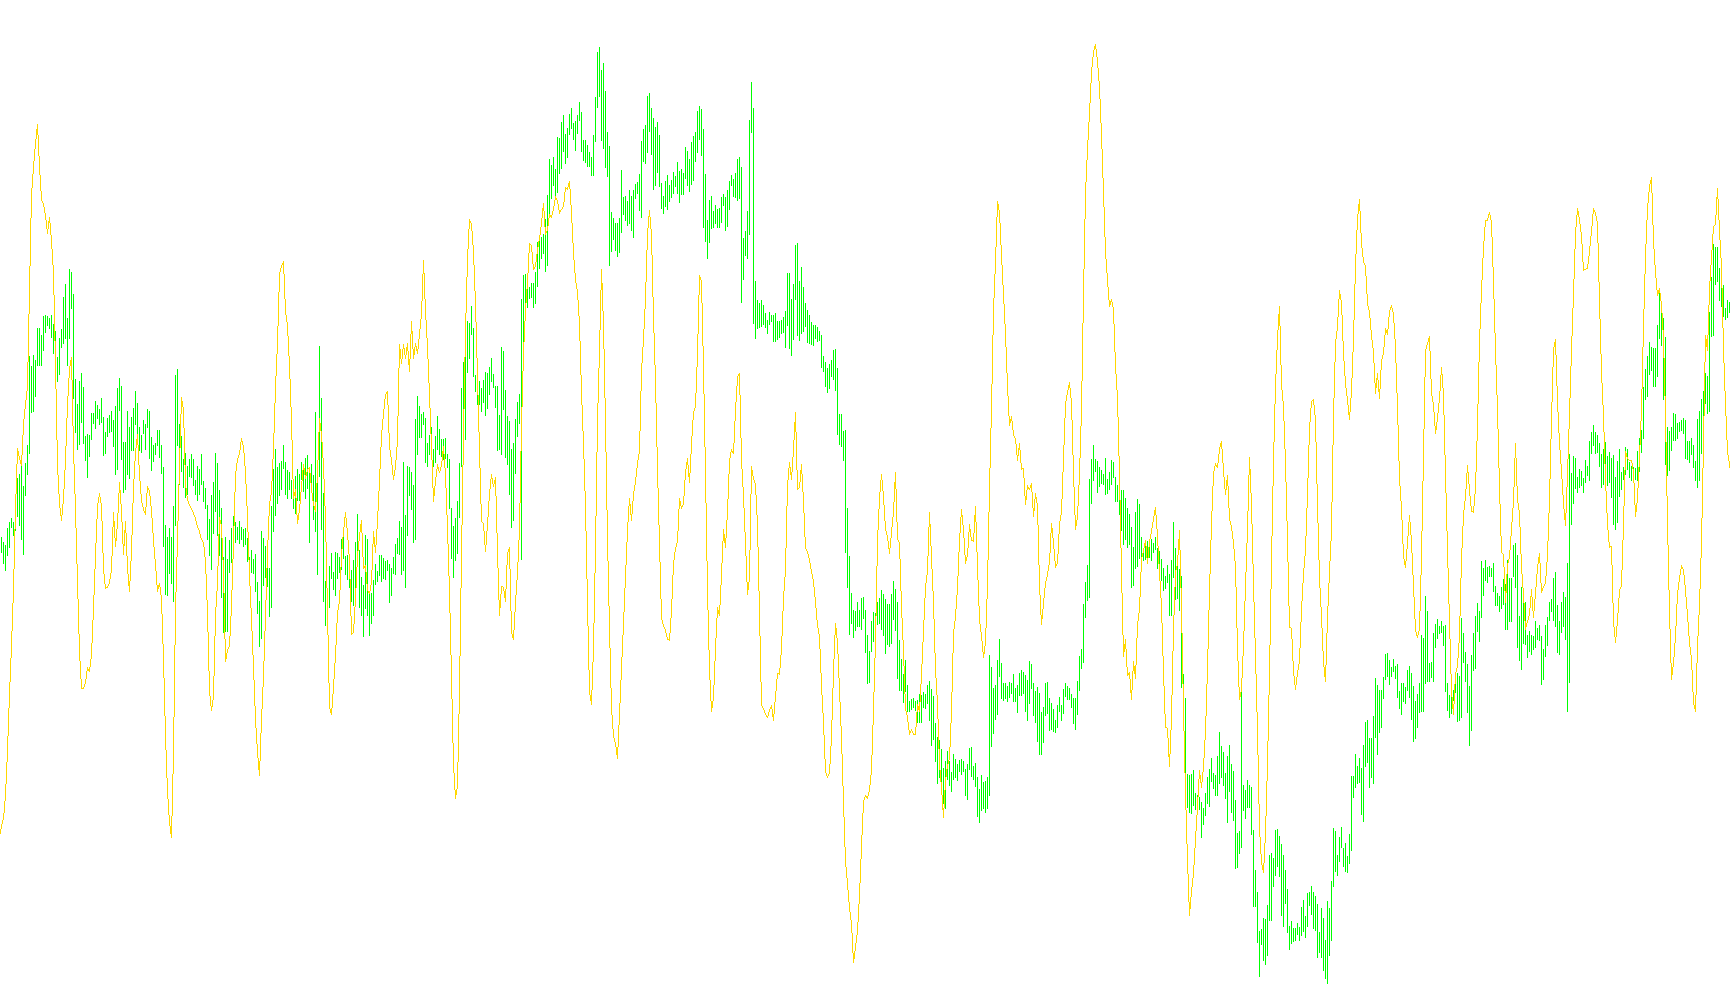
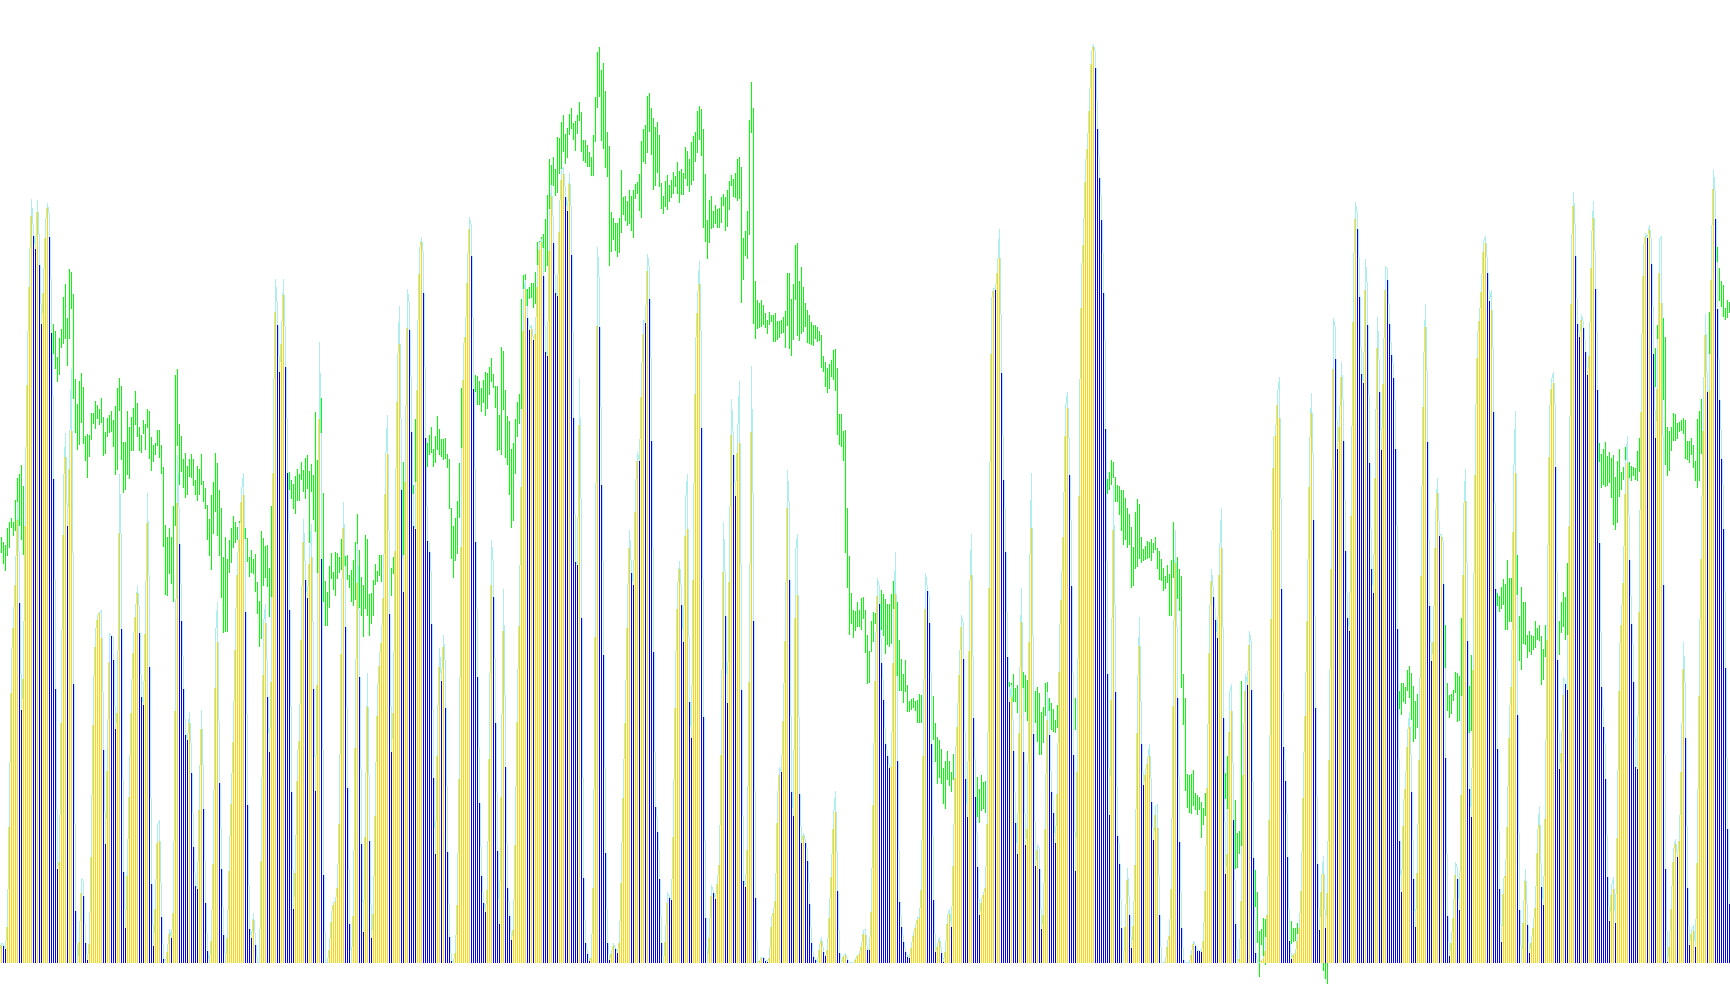
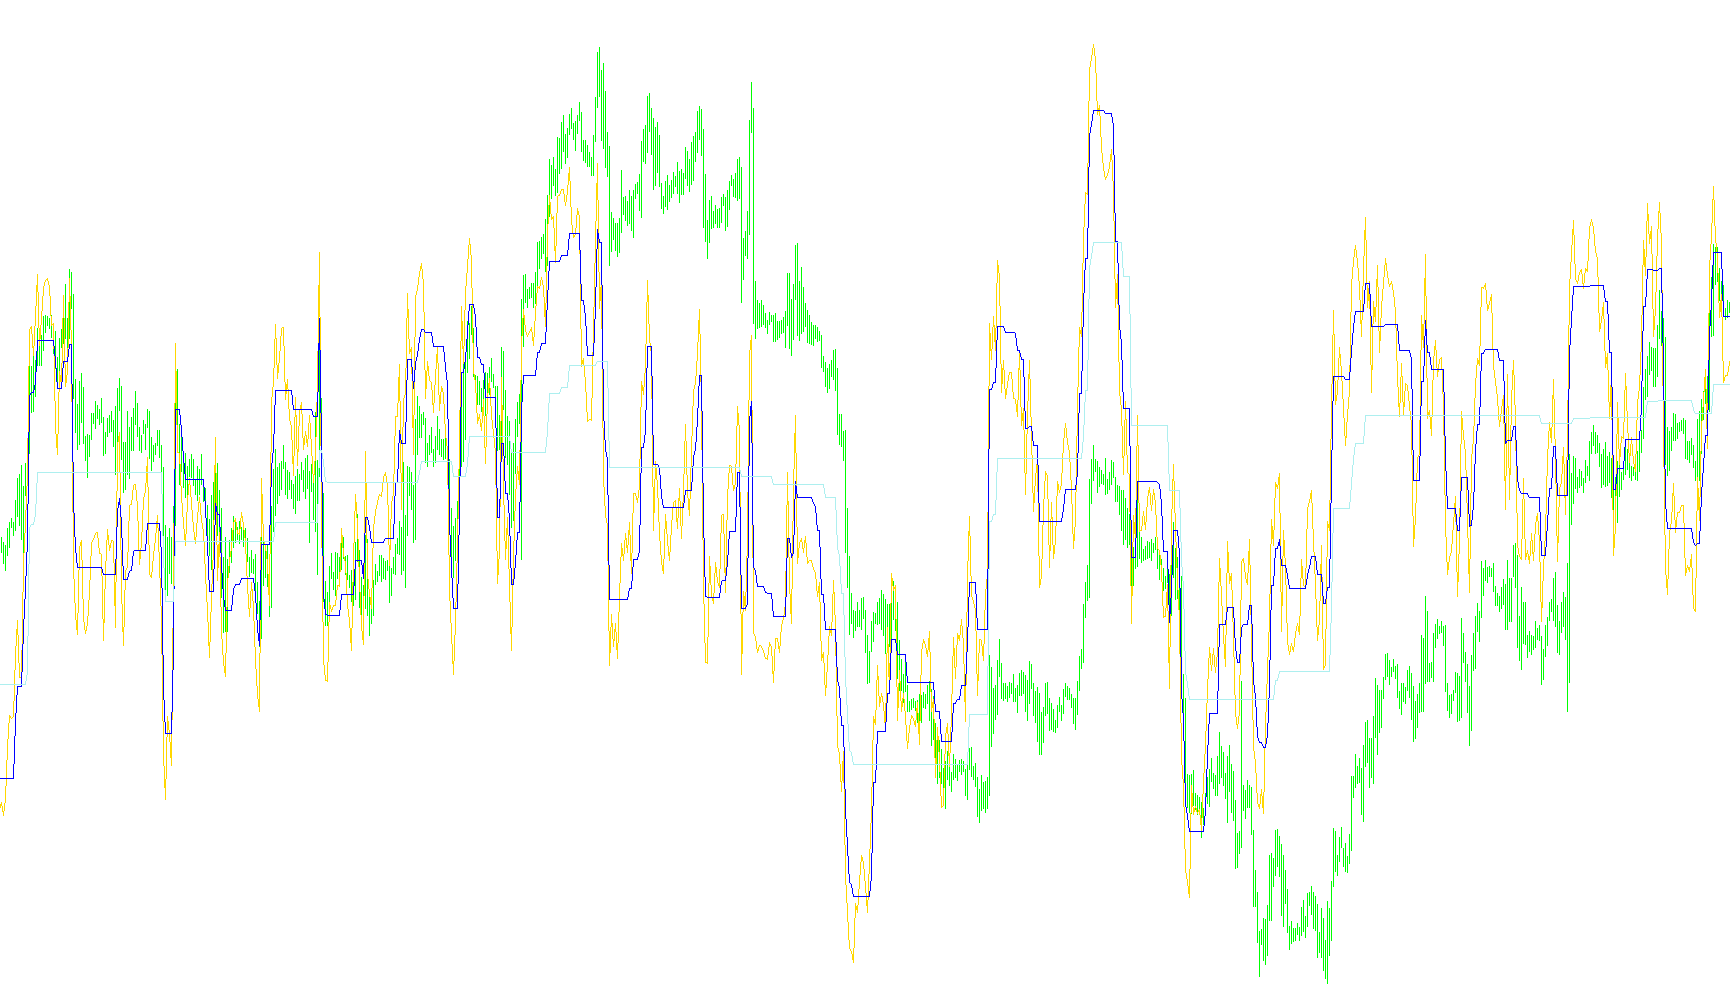
This indicator synthesizes the product of Stochastic and RSI values normalized by Momentum to identify directional shifts via a smoothed moving average filter.

Kwan_indicator
Indicator

Kwan_indicator

iMomentumiMAOnArrayiRSIiStochastic

This indicator derives a synthetic momentum value by normalizing the product of Stochastic and RSI values against the Momentum oscillator, then applying a smoothing moving average to identify trend directional shifts.

MA RSI Alert
Indicator

MA RSI Alert

iMAiRSI

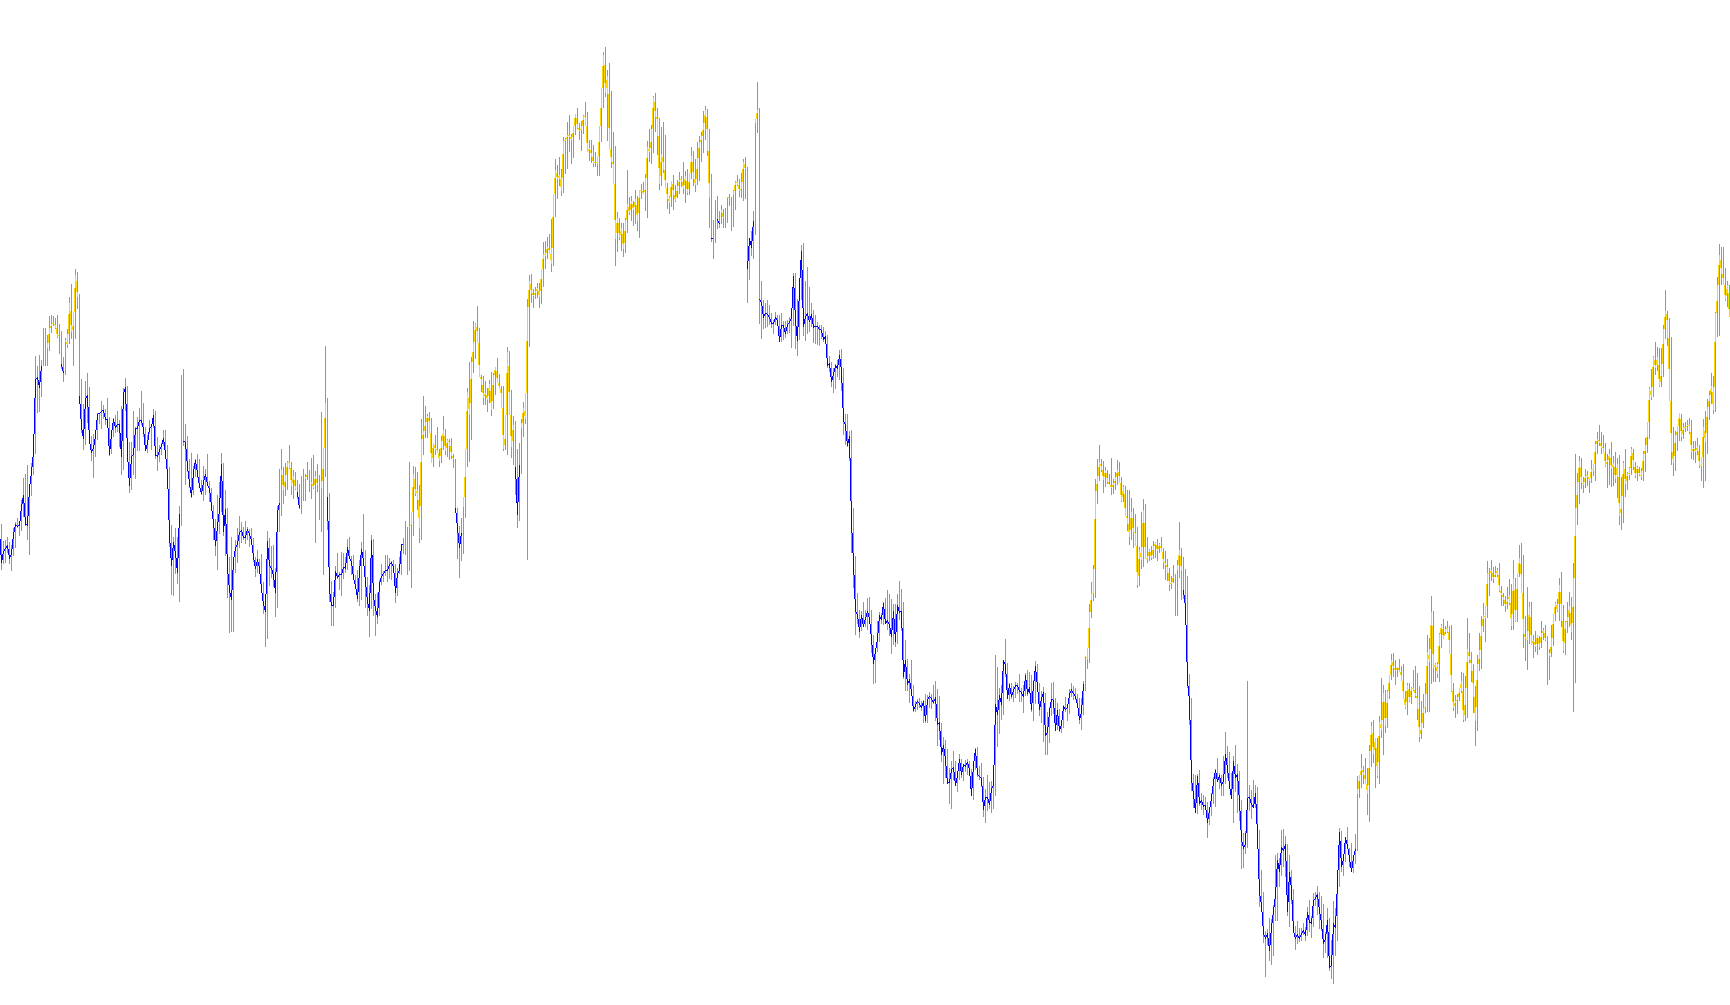
This indicator dynamically plots a smoothed moving average line while switching between bullish and bearish visual states based on Relative Strength Index threshold breaches.

MA rsi
Indicator

MA rsi

iMAiRSI

This indicator bifurcates an Exponential Moving Average into two distinct visual streams based on the Relative Strength Index crossing a specific threshold.

Indicator

MAadaptive (rsi)

iMAiRSI
Indicator

MAadaptive (rsi+r2)

iMAiRSI
Indicator

MAadaptive_(rsi+r2)_cd

iMAiRSI
Indicator

MAadaptive_(rsi+r2)_vel0

iMAiRSI
Indicator

MACD colored + mtf

iCCIiMomentumiMAiRSI
MACD colored
Indicator

MACD colored

iCCIiMomentumiMAiRSI

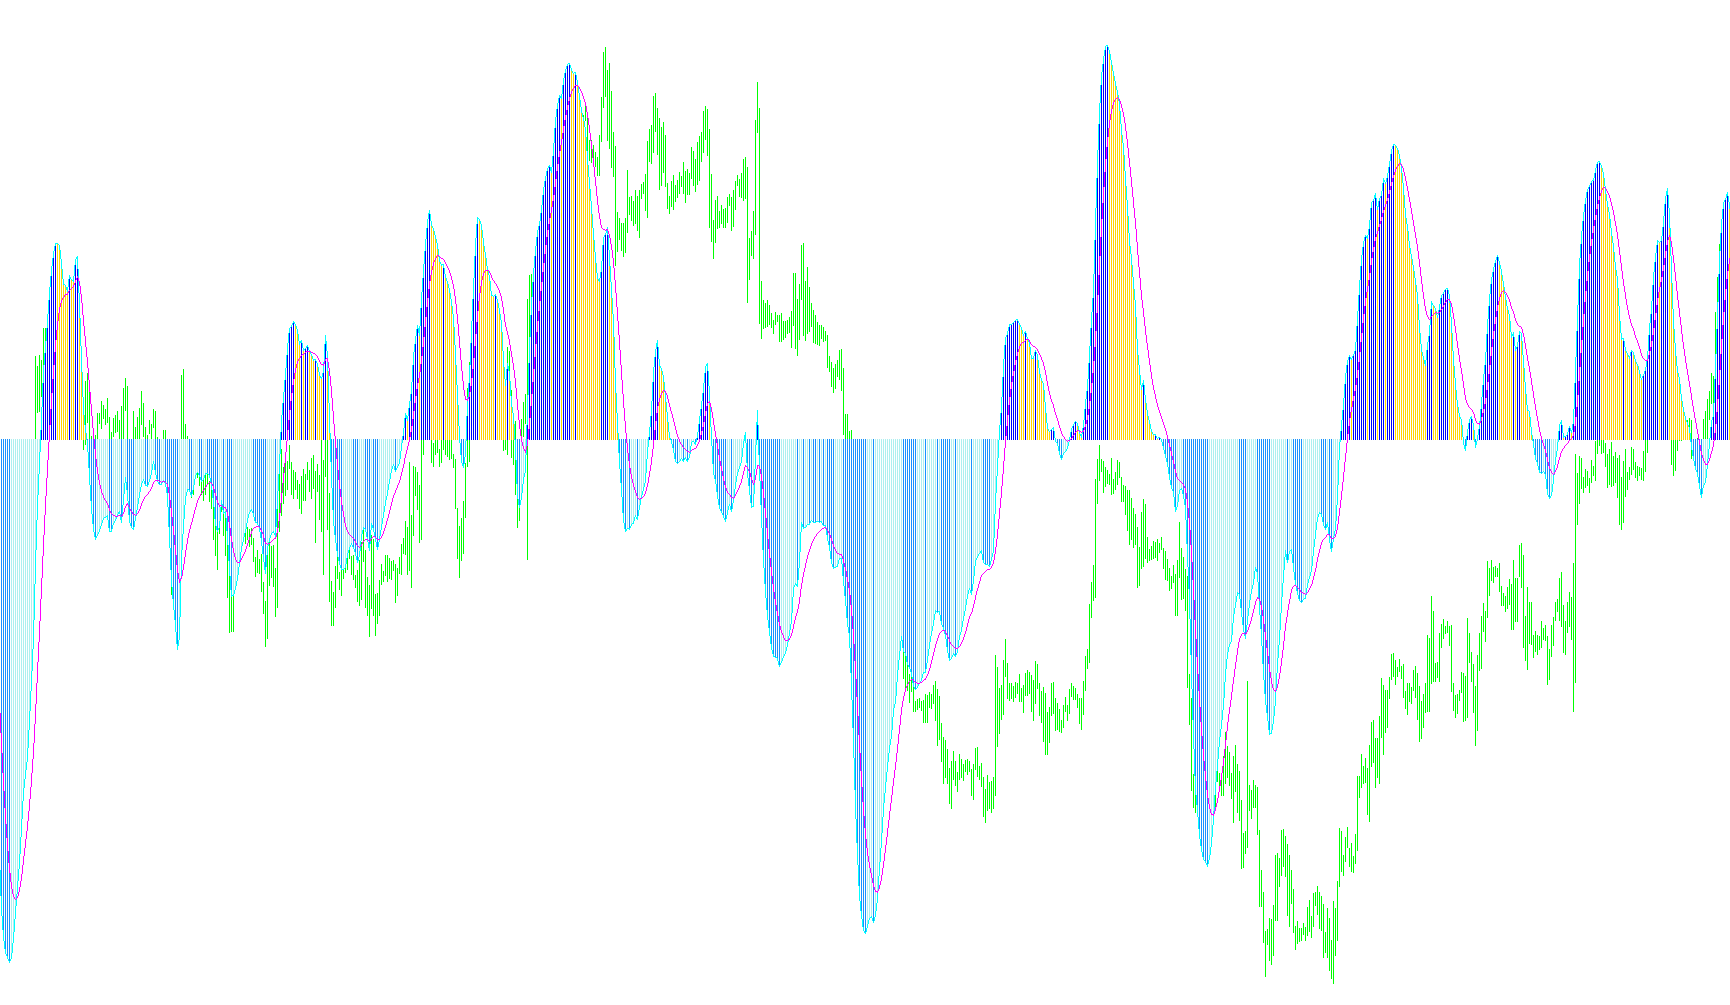
This indicator dynamically visualizes momentum shifts by applying a colored histogram to MACD calculations derived from multiple underlying oscillators including RSI, CCI, and Momentum.

MACD colored_002
Indicator

MACD colored_002

iCCIiMomentumiMAiRSI

This indicator analyzes market momentum by calculating moving average differentials across standard price, RSI, Momentum, and CCI inputs with an optional zero-lag smoothing algorithm.

MAcross_Rsi_Sto_Macd_Fx10SetupTM
Indicator

MAcross_Rsi_Sto_Macd_Fx10SetupTM

iMACDiMAiRSIiStochastic

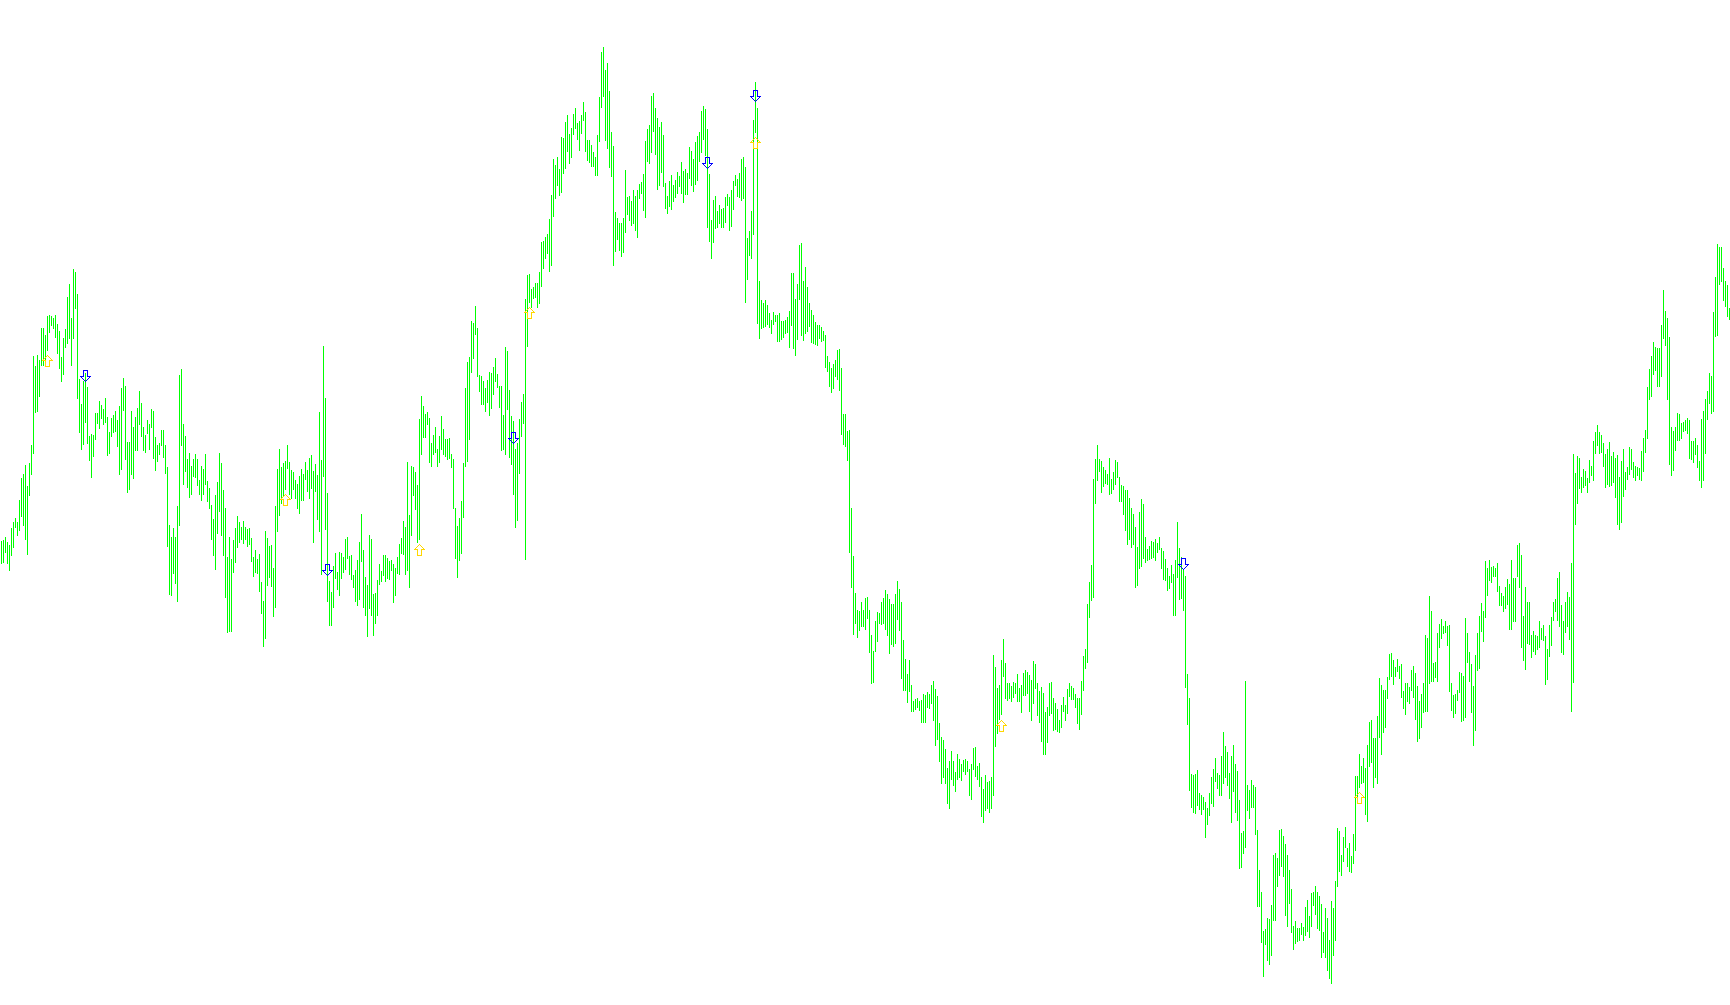
This indicator identifies trend reversal entries by synchronizing Moving Average crossovers with RSI strength thresholds, Stochastic oscillator positioning, and MACD signal line dynamics.

MadroGoldenFilter
Indicator

MadroGoldenFilter

iMACDiADXiMAiRSI
MAProfit
Indicator

MAProfit

iMAiSARiRSI

This indicator identifies trend reversals by monitoring the interaction between fast and slow moving averages across multiple price points while providing automated backtesting for optimal parameter selection.

Indicator

master_info

iCCIiMACDiRSIiStochastic
MA_RSI
Indicator

MA_RSI

iMAOnArrayiRSI

This indicator applies a moving average filter over the Relative Strength Index values to eliminate high-frequency noise and identify underlying trend momentum.

MBA
Indicator

MBA

iMACDiMomentumiRSIiStochastic

This indicator derives a multi-factor signal by normalizing the sum of MACD and RSI against momentum, weighted by stochastic values, and then filters the resulting trajectory to highlight directional shifts.

MBA_Thesis_Indicator_ok
Indicator

MBA_Thesis_Indicator_ok

iMACDiMomentumiRSIiStochastic

This indicator calculates a multi-factor composite value by multiplying Stochastic values with the sum of MACD and RSI, normalized by Momentum, then applying a directional SMA smoothing filter.

MBA_Thesis_Indicator_ok_v1
Indicator

MBA_Thesis_Indicator_ok_v1

iMACDiMomentumiRSIiStochastic

The indicator calculates a composite oscillator by normalizing the sum of MACD and RSI values against Momentum, then applies a Moving Average to identify directional trend shifts.

METRO
Indicator

METRO

iRSI

This indicator overlays dynamic volatility bands onto the Relative Strength Index to visualize multi-speed momentum shifts and structural trend breakouts.

METRO_v1
Indicator

METRO_v1

iRSI

This indicator overlays two dynamic step-based volatility boundaries onto a standard Relative Strength Index to visualize multi-speed momentum shifts and trend exhaustion.

METRO_v2
Indicator

METRO_v2

iRSI

This indicator identifies trend exhaustion and structural shifts by projecting dynamic upper and lower boundaries based on multi-step RSI deviations.

MidDay
Indicator

MidDay

iRSI

The indicator identifies trend reversals by mapping M1 timeframe RSI values against a 50-level threshold to trigger directional signals on the current chart.

Mint signal2.1_cl_2
Indicator

Mint signal2.1_cl_2

iCCIiMAiRSI

This indicator visualizes real-time trend alignment across six concurrent timeframes by evaluating the intersection of Exponential Moving Averages, Relative Strength Index, and Commodity Channel Index levels.

Mint signal2
Indicator

Mint signal2

iCCIiMAiRSI

This indicator visualizes bullish or bearish sentiment across five concurrent timeframes by evaluating the alignment of EMA crossovers, RSI levels, and CCI values.

Min_Max_RSI
Indicator

Min_Max_RSI

iRSI

The indicator identifies relative strength extremes by tracking the local highest and lowest RSI values independently above and below the 50.0 neutral midline.

mj_RSIFilter_v1.0
Indicator

mj_RSIFilter_v1.0

iRSI

This indicator categorizes market momentum into four distinct intensity zones—Strong Bullish, Mild Bullish, Mild Bearish, and Strong Bearish—by segmenting the Relative Strength Index into specific threshold bands.

MMR
Indicator

MMR

iMACDiMAiRSI

This indicator synthesizes EMA and LWMA crossover dynamics with MACD momentum and RSI strength to generate a consolidated trend volatility signal.

ModiSimple
Indicator

ModiSimple

iATRiMACDiMAiRSI

This indicator synthesizes RSI acceleration, MACD trend dynamics, and multi-mode ATR-based trailing stops to identify high-probability trend reversals and automated risk management.
MoR
Indicator

MoR

iMAOnArrayiRSI

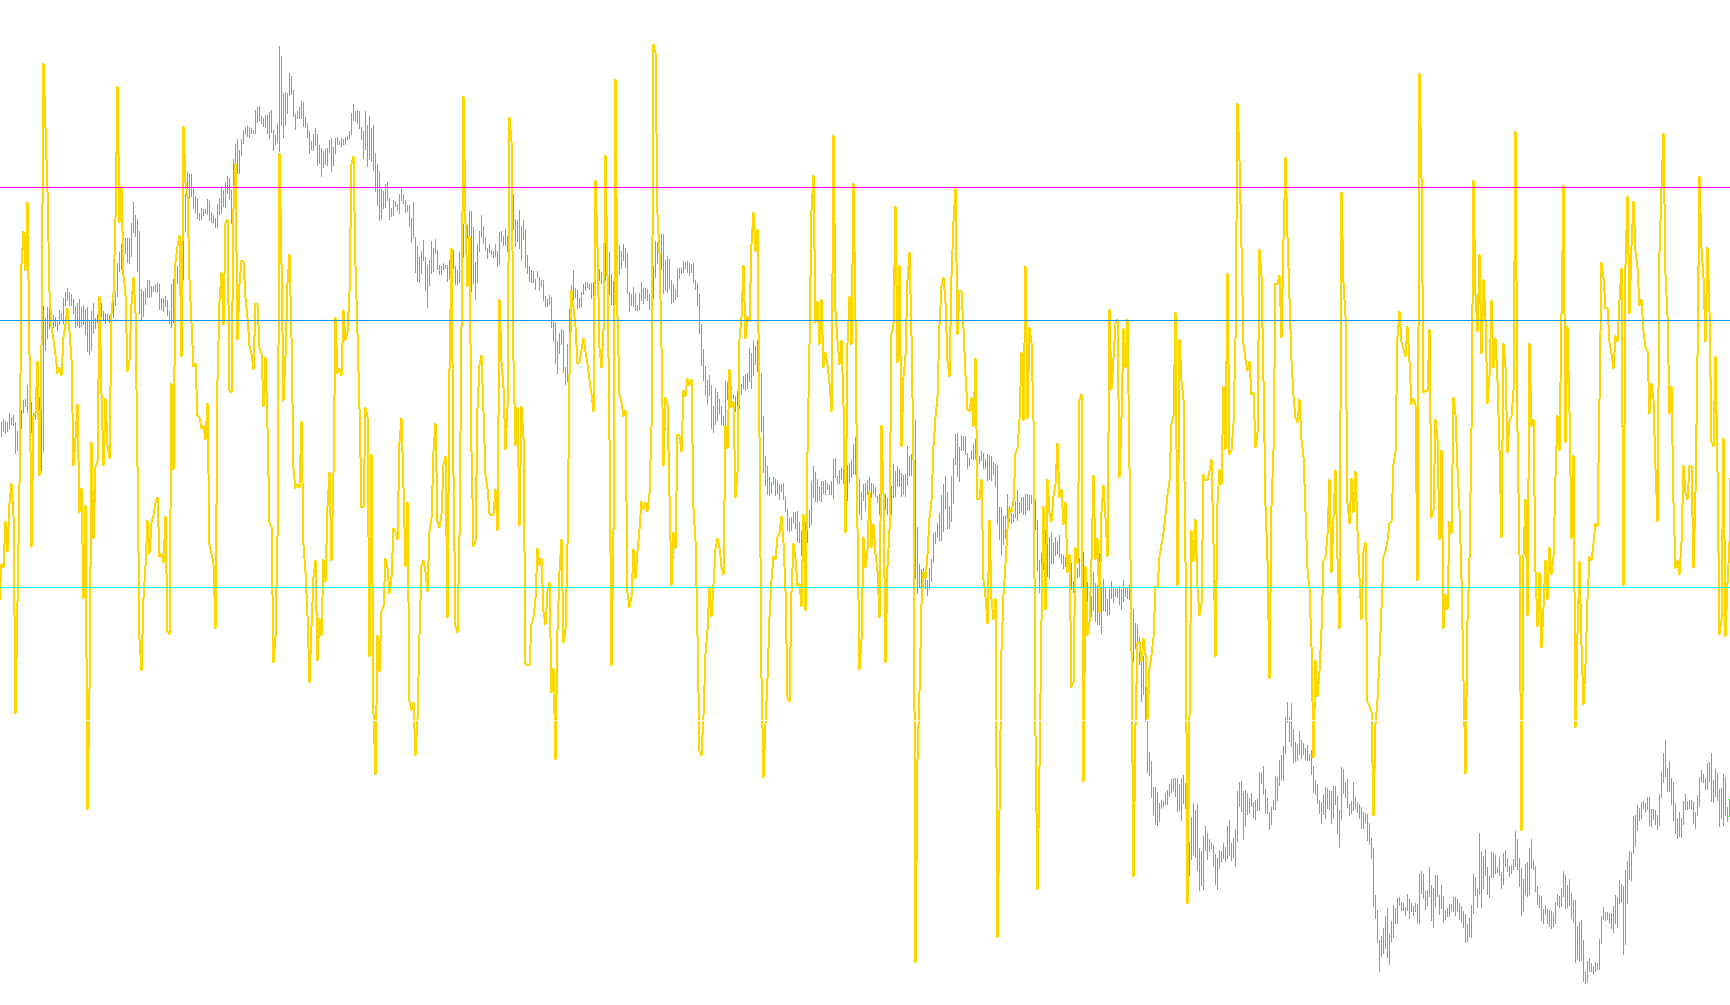
This indicator synthesizes momentum by calculating the percentage ratio between two moving averages derived from the RSI values to identify trend strength and exhaustion.

Indicator

MoR_MTF_Test

iMAOnArrayiRSI
MoR_v1
Indicator

MoR_v1

iMAOnArrayiRSI

This indicator calculates a dynamic momentum ratio by dividing two different moving averages derived from the Relative Strength Index.

MTF Relative Strength Index
Indicator

MTF Relative Strength Index

iRSI

This indicator projects Relative Strength Index values from higher timeframes onto the current chart to identify underlying momentum trends across multiple periodicities.

Indicator

mtf_3xRSI

iRSI
MTF_MARSI_v0.10
Indicator

MTF_MARSI_v0.10

iMAOnArrayiRSI

This indicator synchronizes and displays smoothed Relative Strength Index values across six concurrent timeframes to identify multi-layered momentum trends.

MTF_MARSI_v0.10_001
Indicator

MTF_MARSI_v0.10_001

iMAOnArrayiRSI

This indicator synchronizes and displays real-time Relative Strength Index values and their moving average smoothed counterparts across six distinct timeframes simultaneously on a single dashboard.

MTF_MARSI_v0.20
Indicator

MTF_MARSI_v0.20

iMAOnArrayiRSI

This indicator synchronizes Relative Strength Index (RSI) data across six distinct timeframes into a single visual dashboard, applying moving average smoothing to identify momentum trends.

MTF_MARSI_v0.20_001
Indicator

MTF_MARSI_v0.20_001

iMAOnArrayiRSI

This indicator synchronizes and visualizes Relative Strength Index data across six concurrent timeframes (M1 to H4) using smoothed moving averages to identify cross- khung momentum.

MTF_MARSI_v0.20_v1
Indicator

MTF_MARSI_v0.20_v1

iMAOnArrayiRSI

This indicator synchronizes and overlays smoothed Relative Strength Index (RSI) values across six distinct timeframes simultaneously to visualize multi-layered momentum shifts and trend exhaustion.

mtf_rsi
Indicator

mtf_rsi

iRSI

Visualizes multiple Relative Strength Index oscillations simultaneously in a single window, partitioned by selectable temporal horizons to identify overarching market momentum.

Indicator

MTF_RSI_4PerX4TF_Dots_[cw]

iRSI
MTF_RSI_4TF_X4
Indicator

MTF_RSI_4TF_X4

iRSI

This indicator overlays four concurrent Relative Strength Index (RSI) values from different timeframes onto a single chart to visualize multi-period momentum trends.

Indicator

MTF_T3_RSI_001

iRSI
MTF_WaddahAttar_RSI_Levels
Indicator

MTF_WaddahAttar_RSI_Levels

iRSI

This indicator projects multi-timeframe Relative Strength Index levels onto the current chart by calculating price coordinates based on momentum velocity and historical oscillation variance.

Indicator

Multi pair RSI+EMA mtf

iMAOnArrayiRSI
Indicator

Multi pair RSI+EMA

iRSI
Multi.Period.RSI
Indicator

Multi.Period.RSI

iRSI

This indicator calculates the Relative Strength Index by automatically mapping lower-interval inputs to their corresponding nearest standardized higher-timeframe archetypes.

Multipaires indicator_V2
Indicator

Multipaires indicator_V2

iBullsPoweriCCIiOBViRSI
MultiRSI
Indicator

MultiRSI

iRSI

This indicator aggregates and visualizes synchronized Relative Strength Index values across multiple concurrent timeframes to identify high-probability trend alignment.
Indicator

multisymbol_color-RSI_LQ_1.0

iRSI