Ehlers Fisher transform
Indicator

Ehlers Fisher transform

iMA

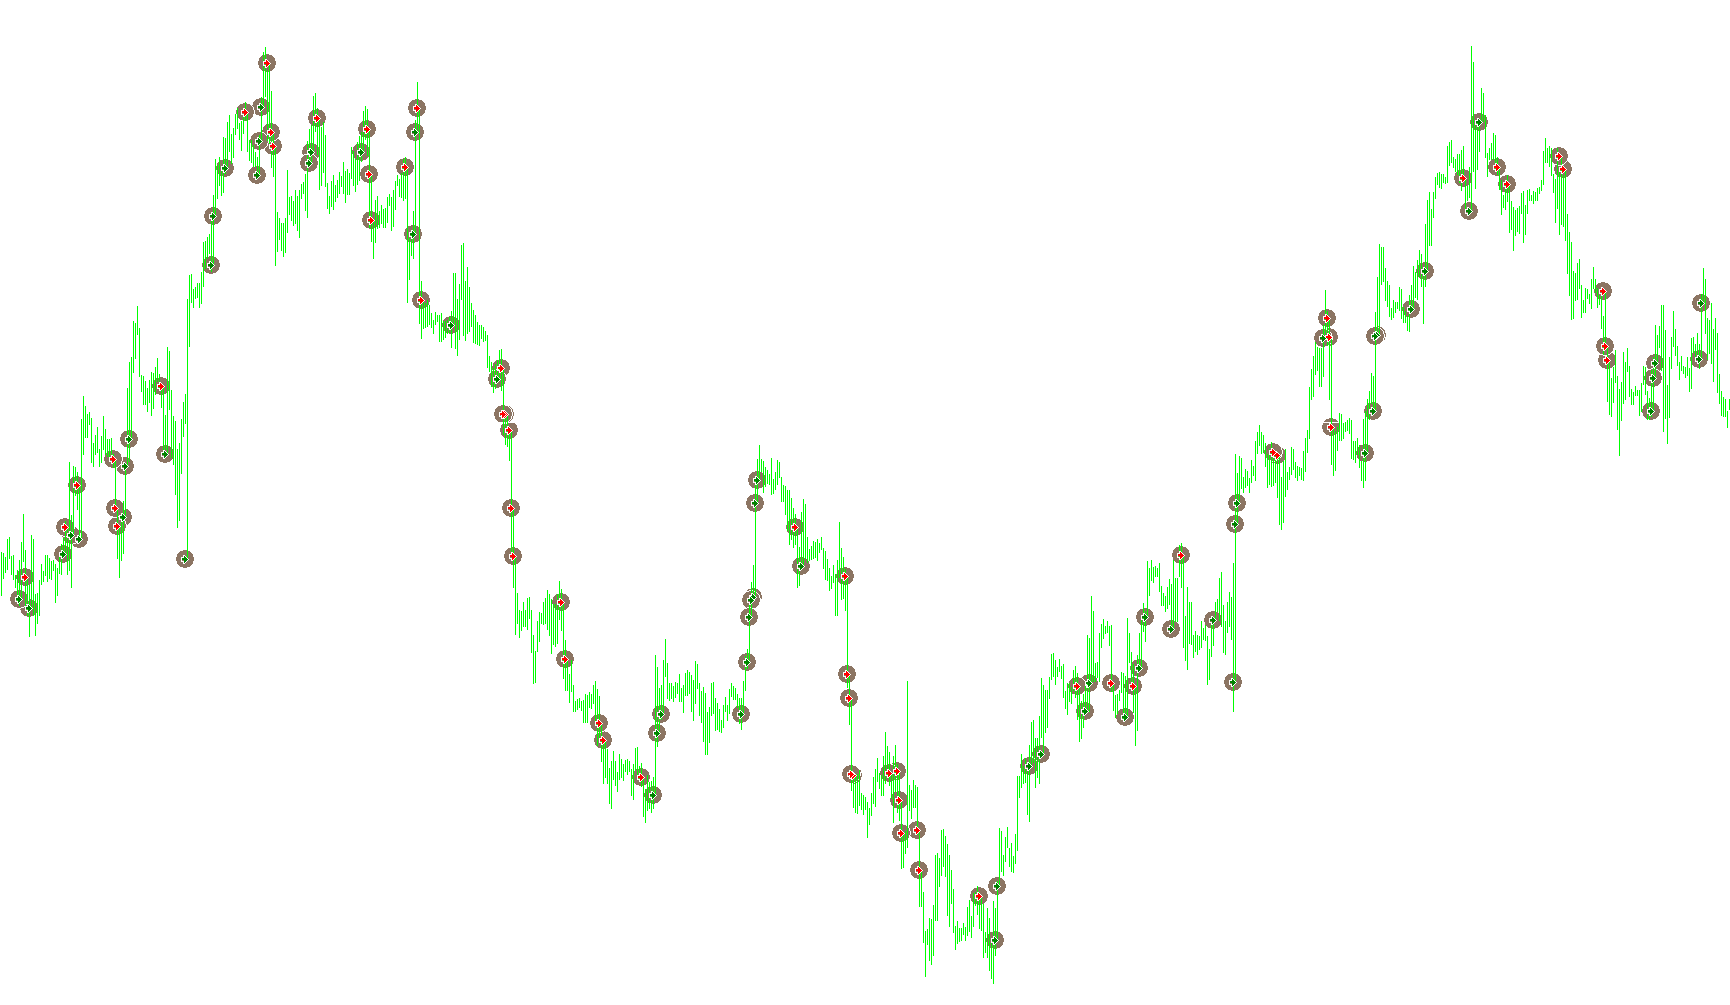
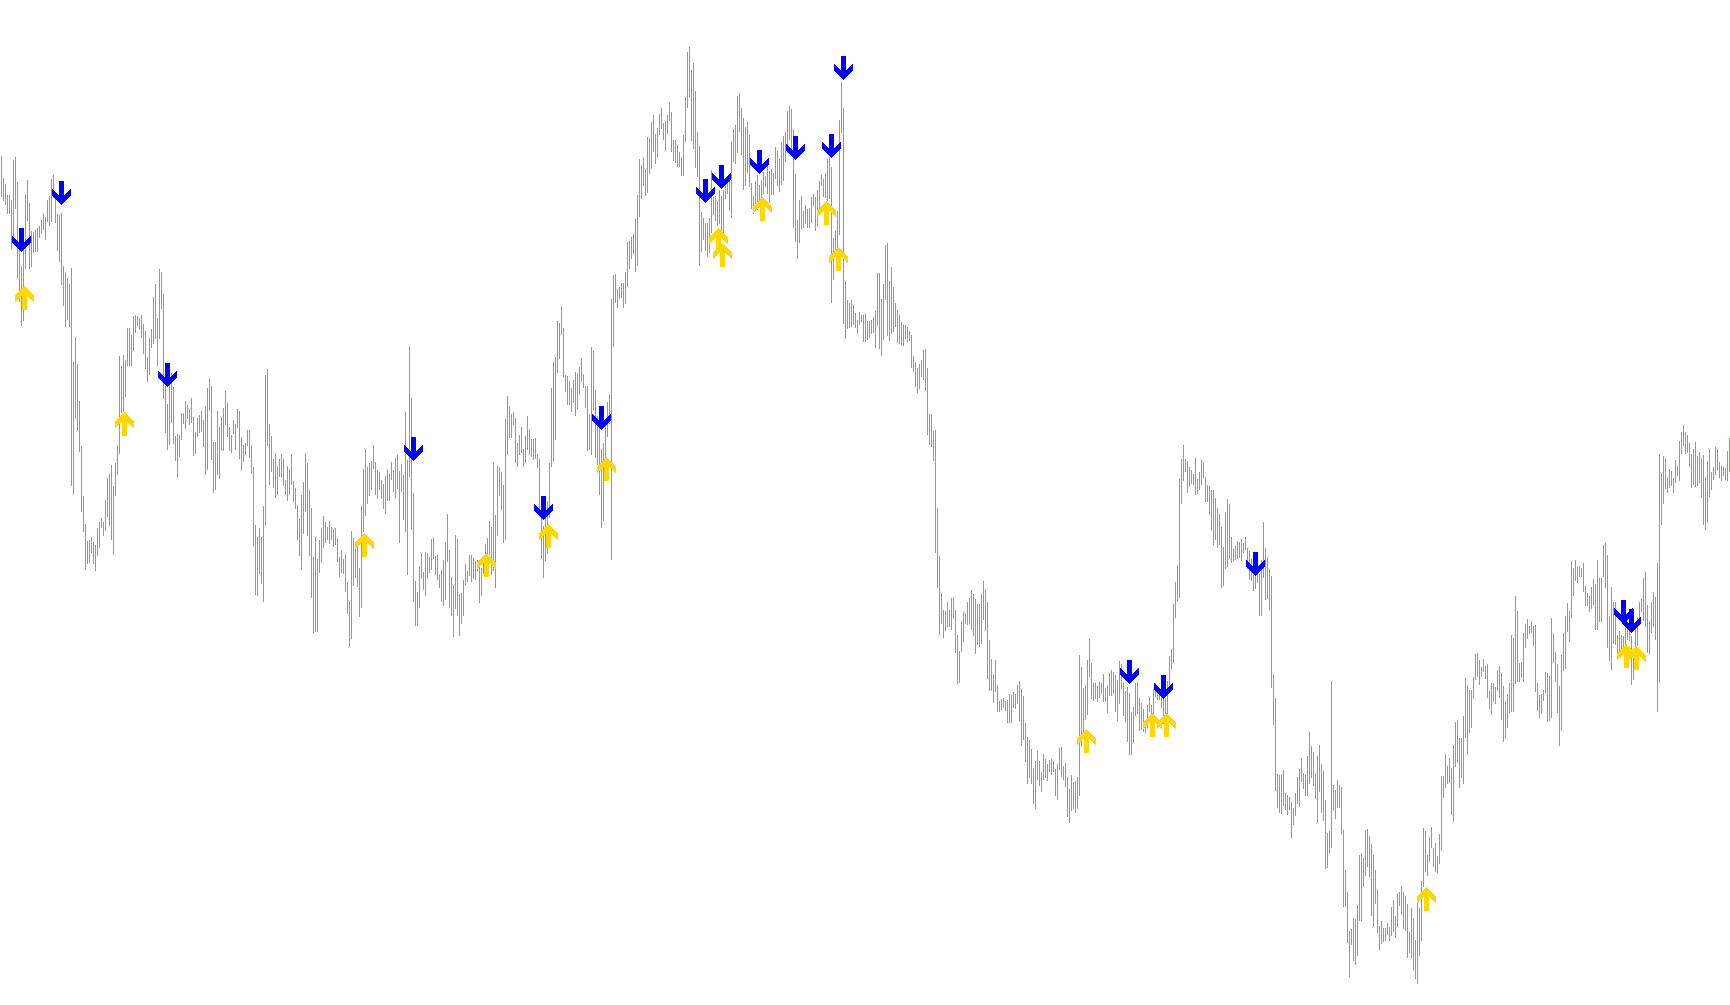
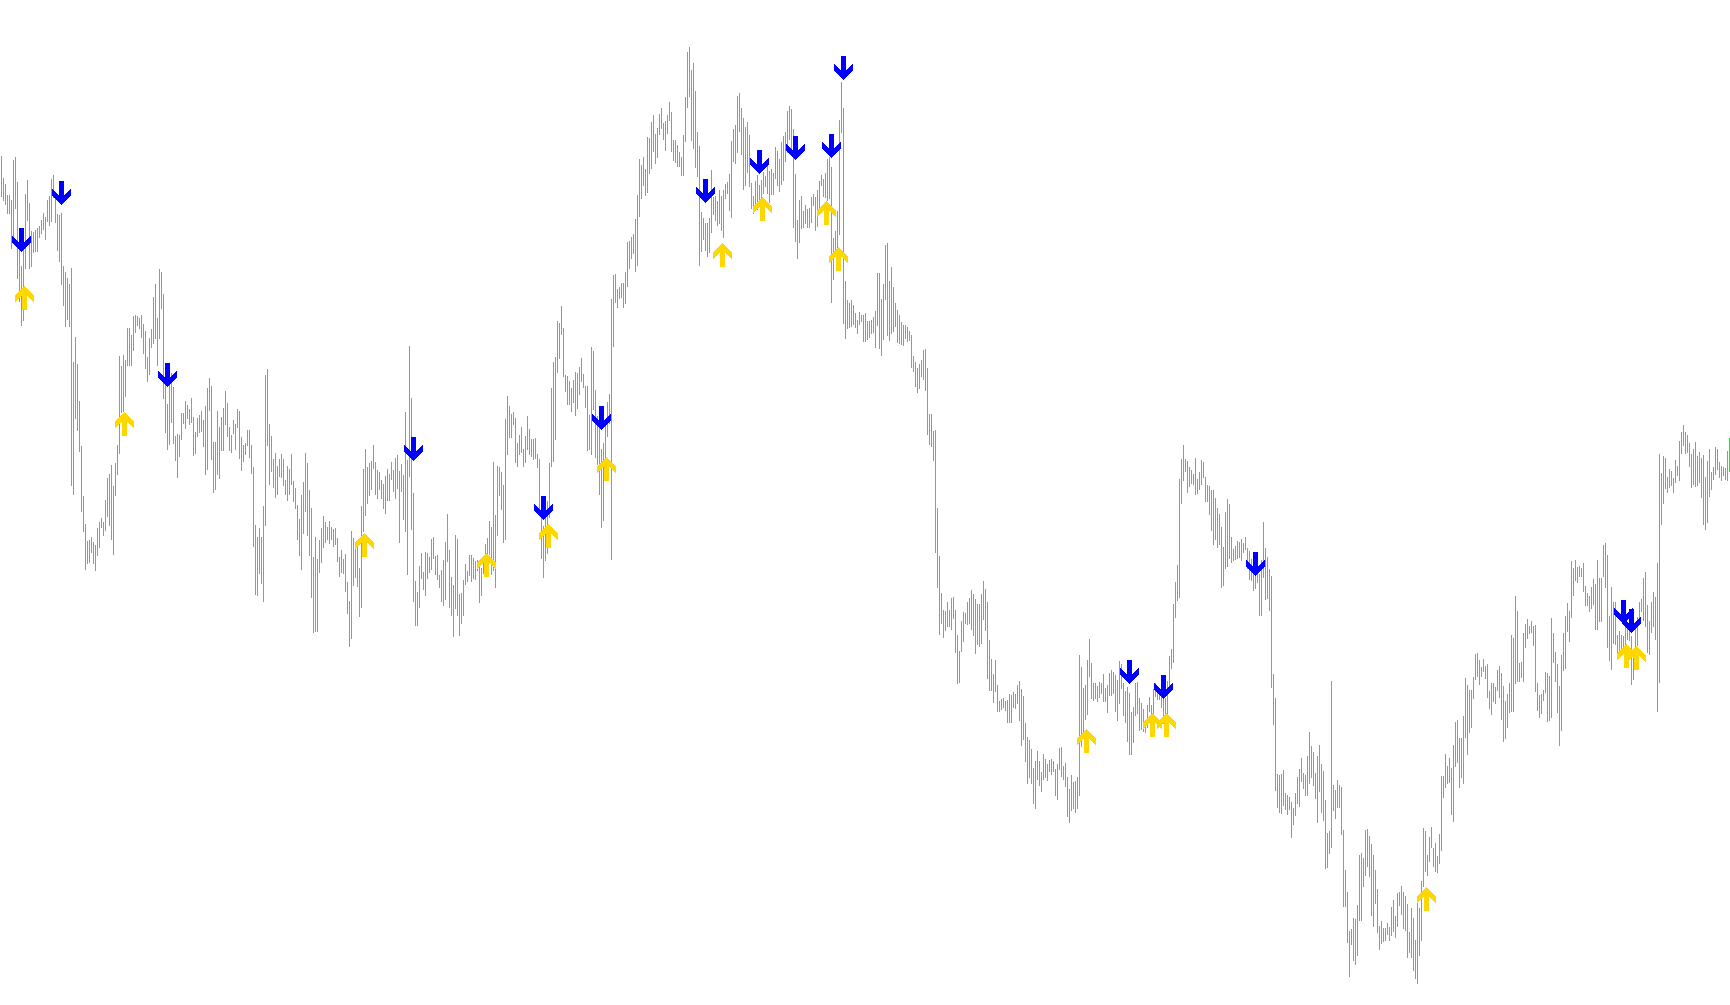
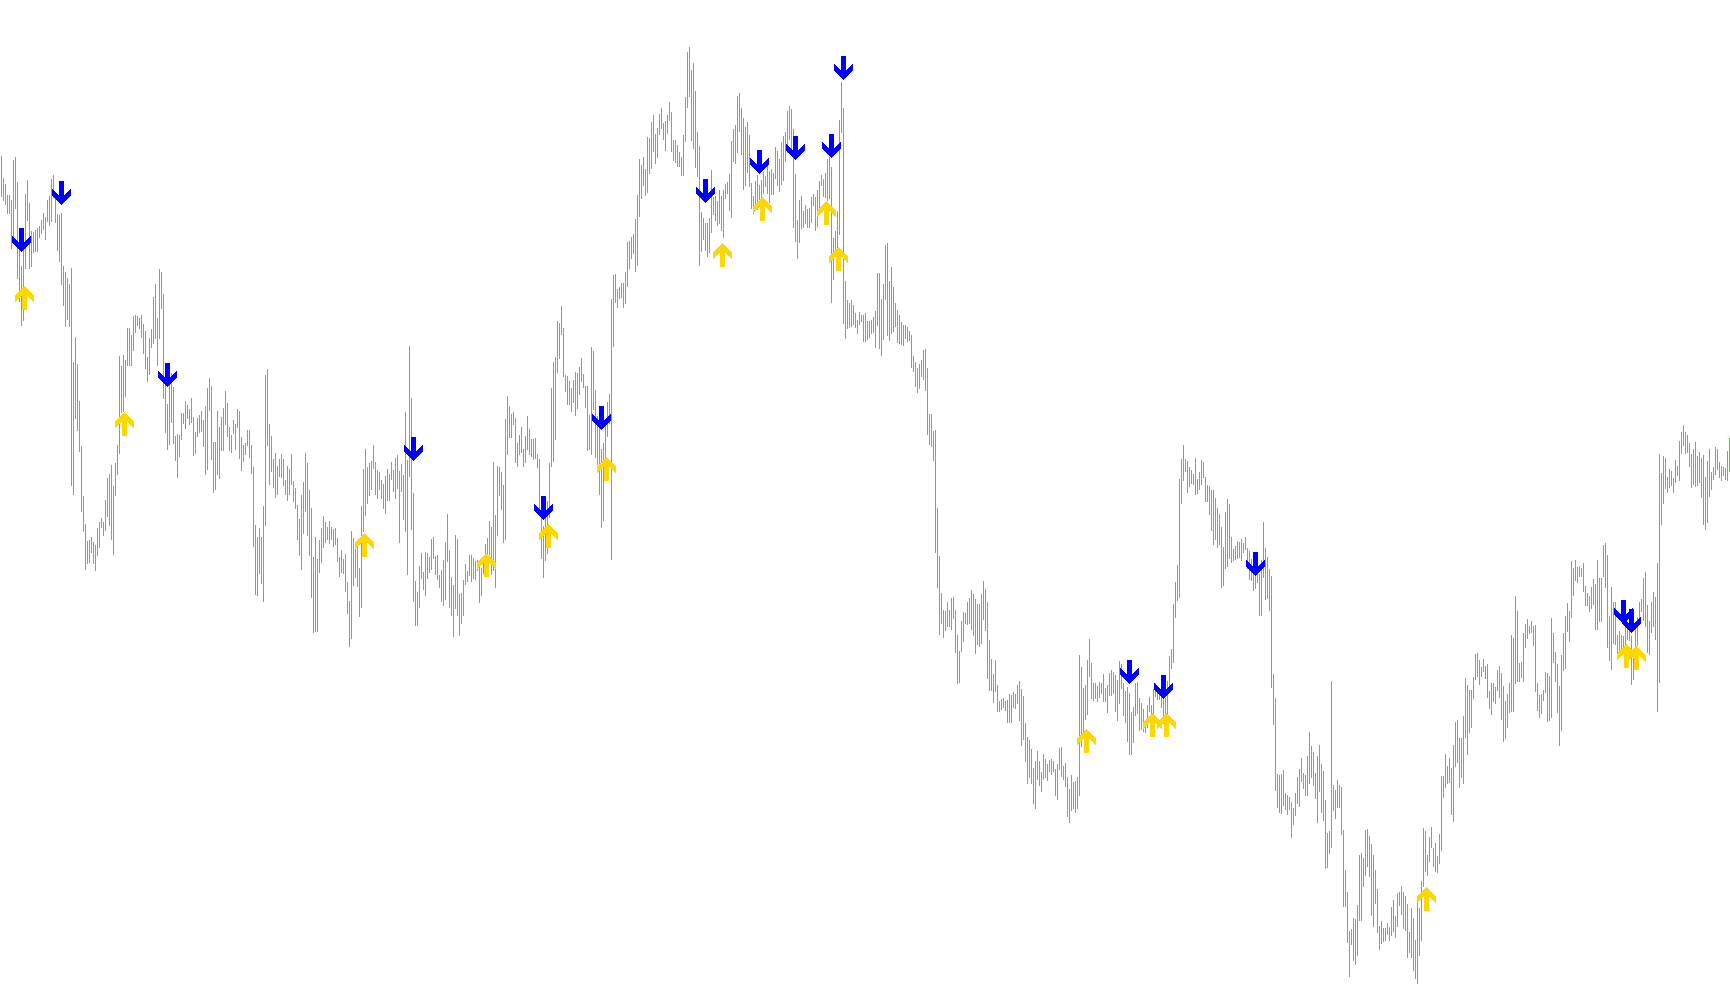
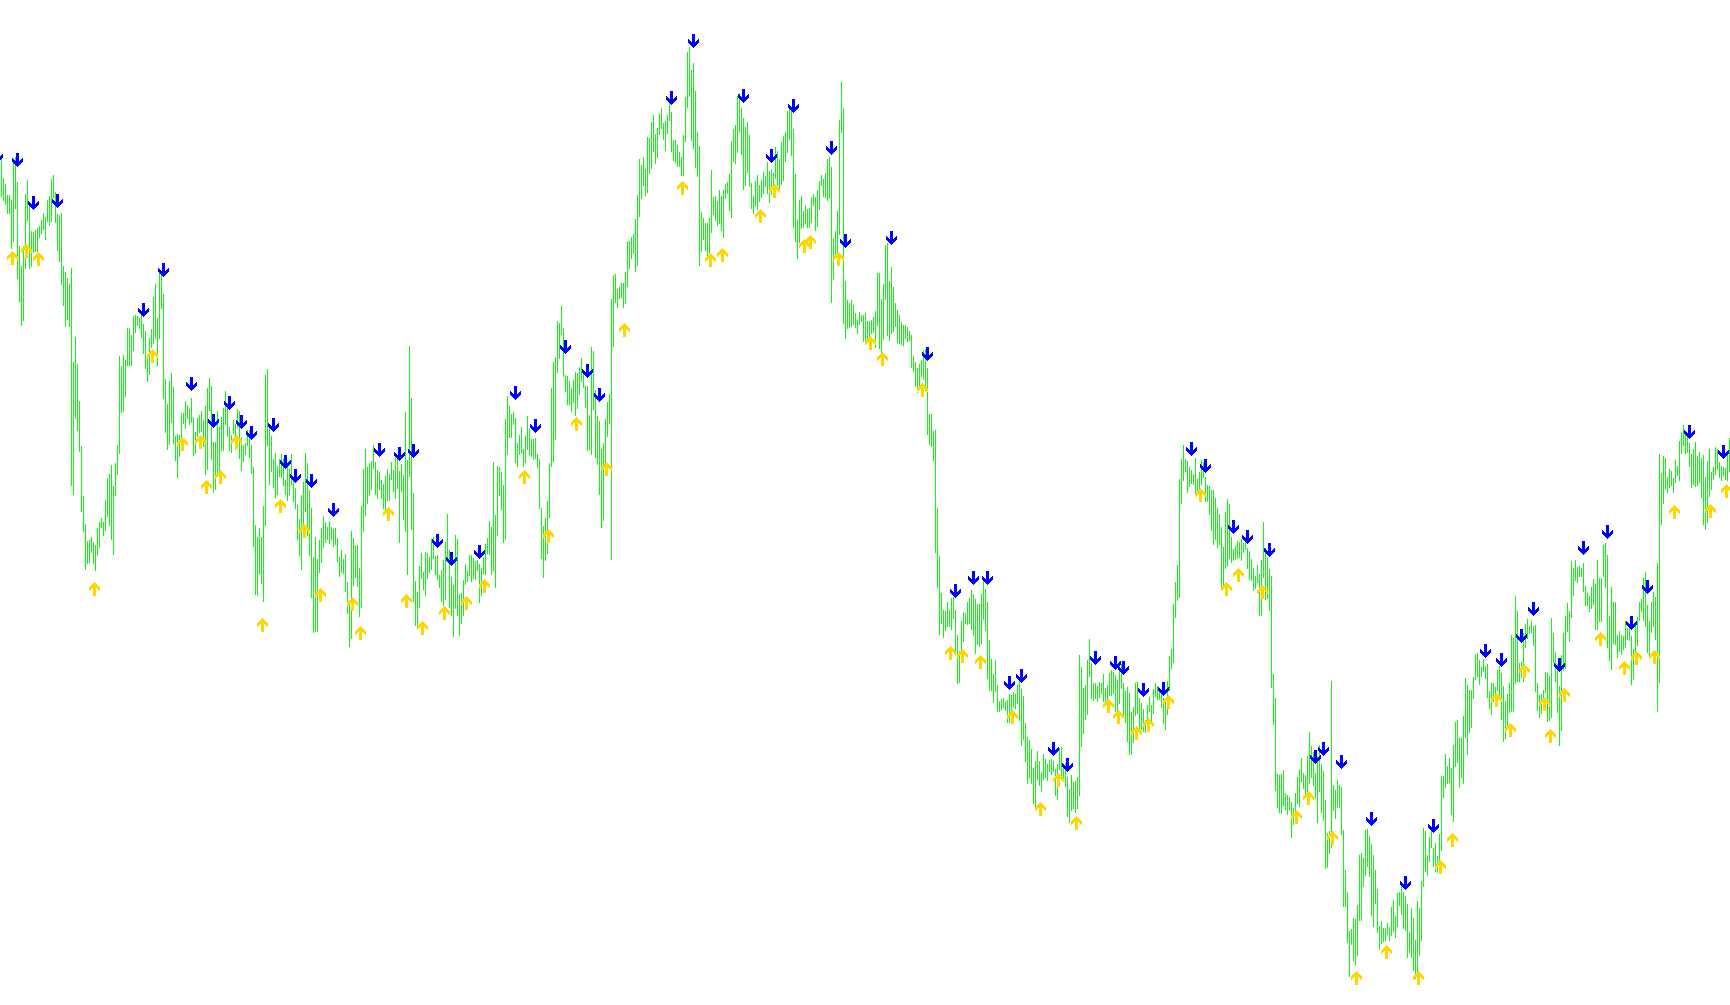
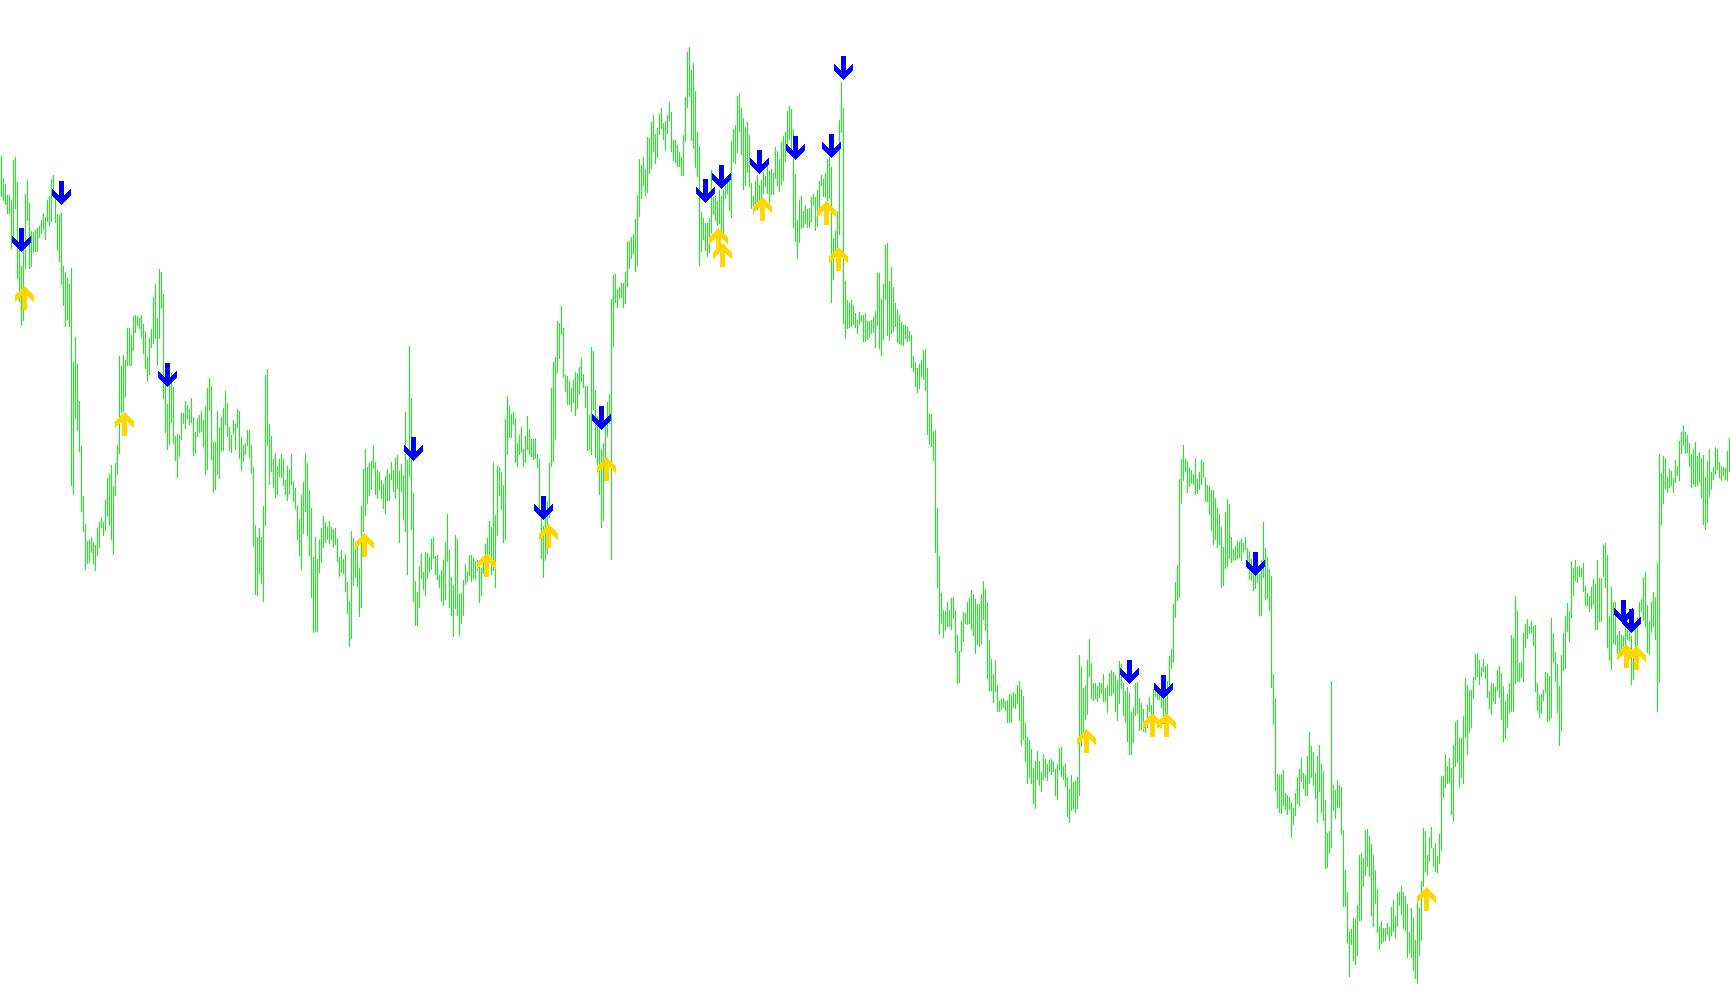
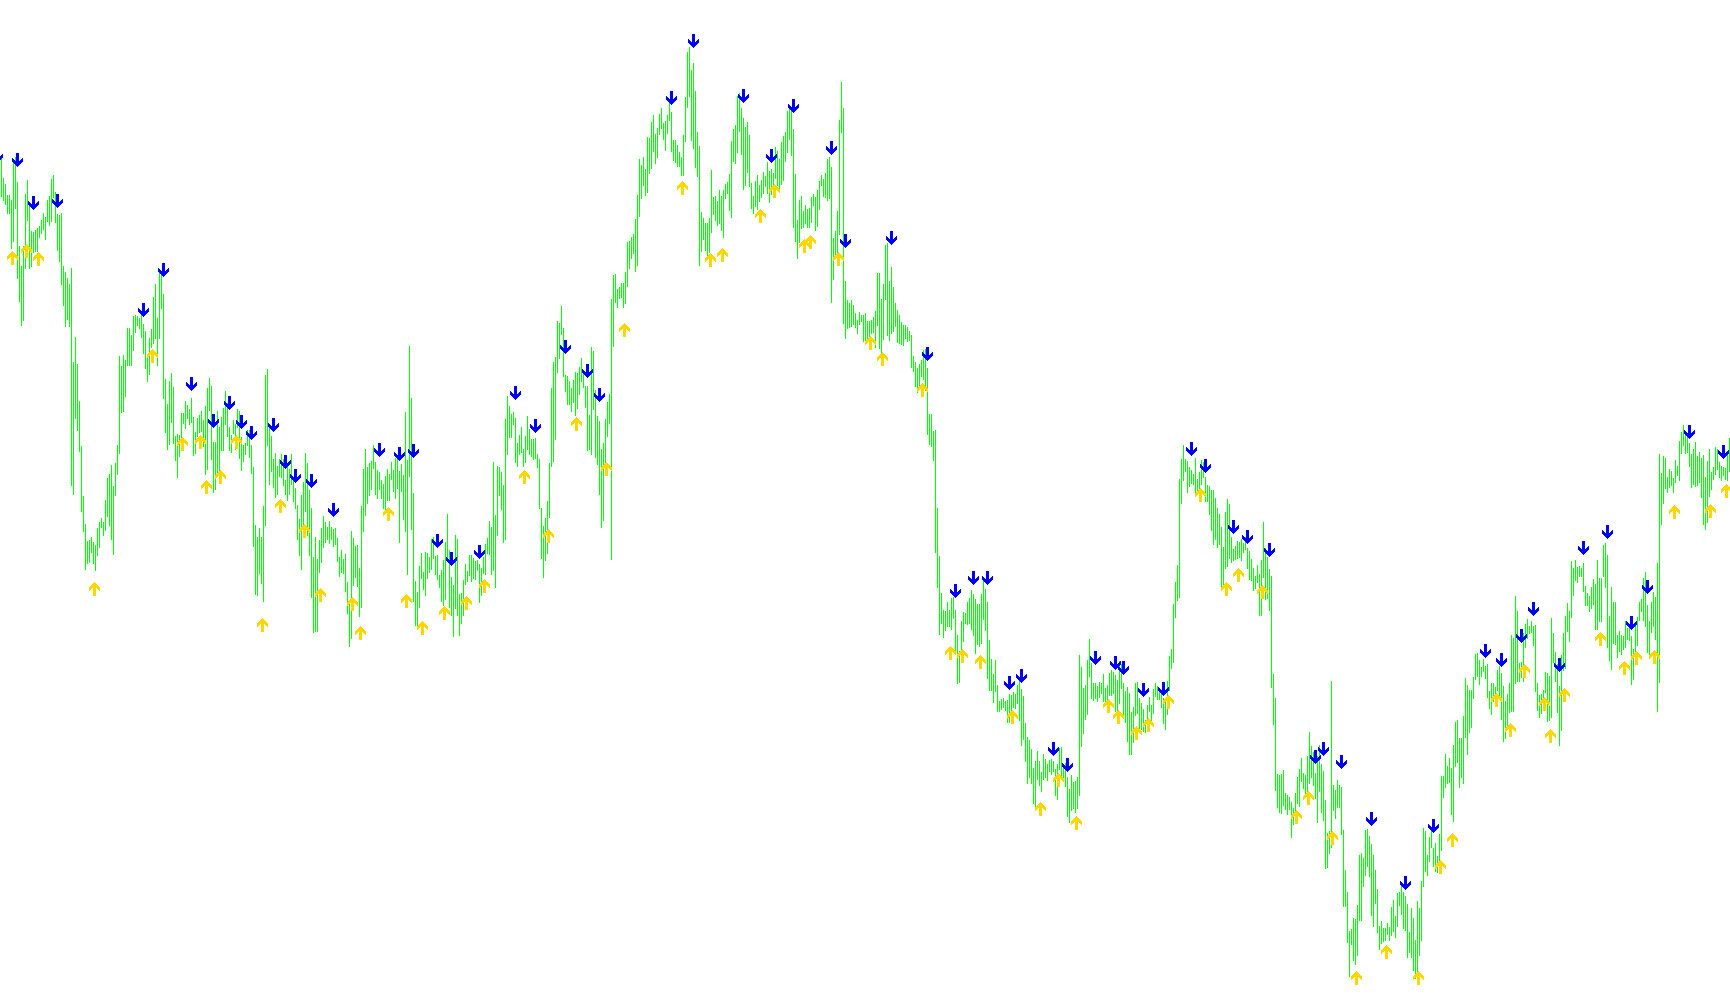
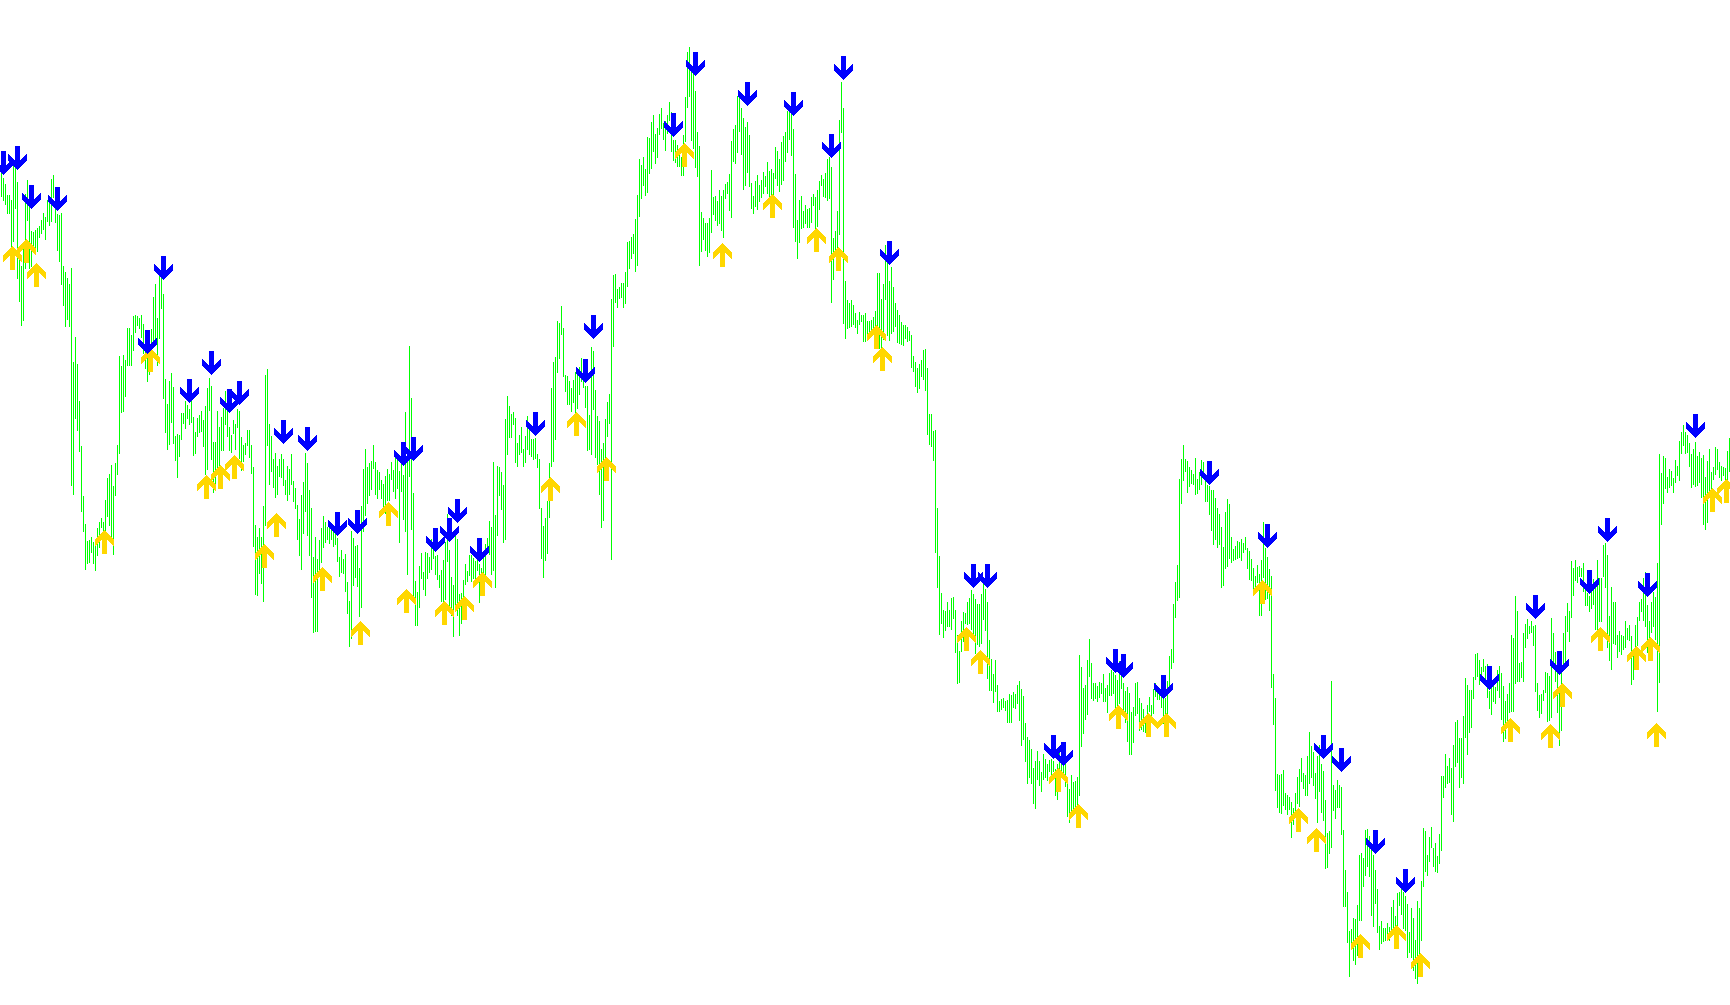
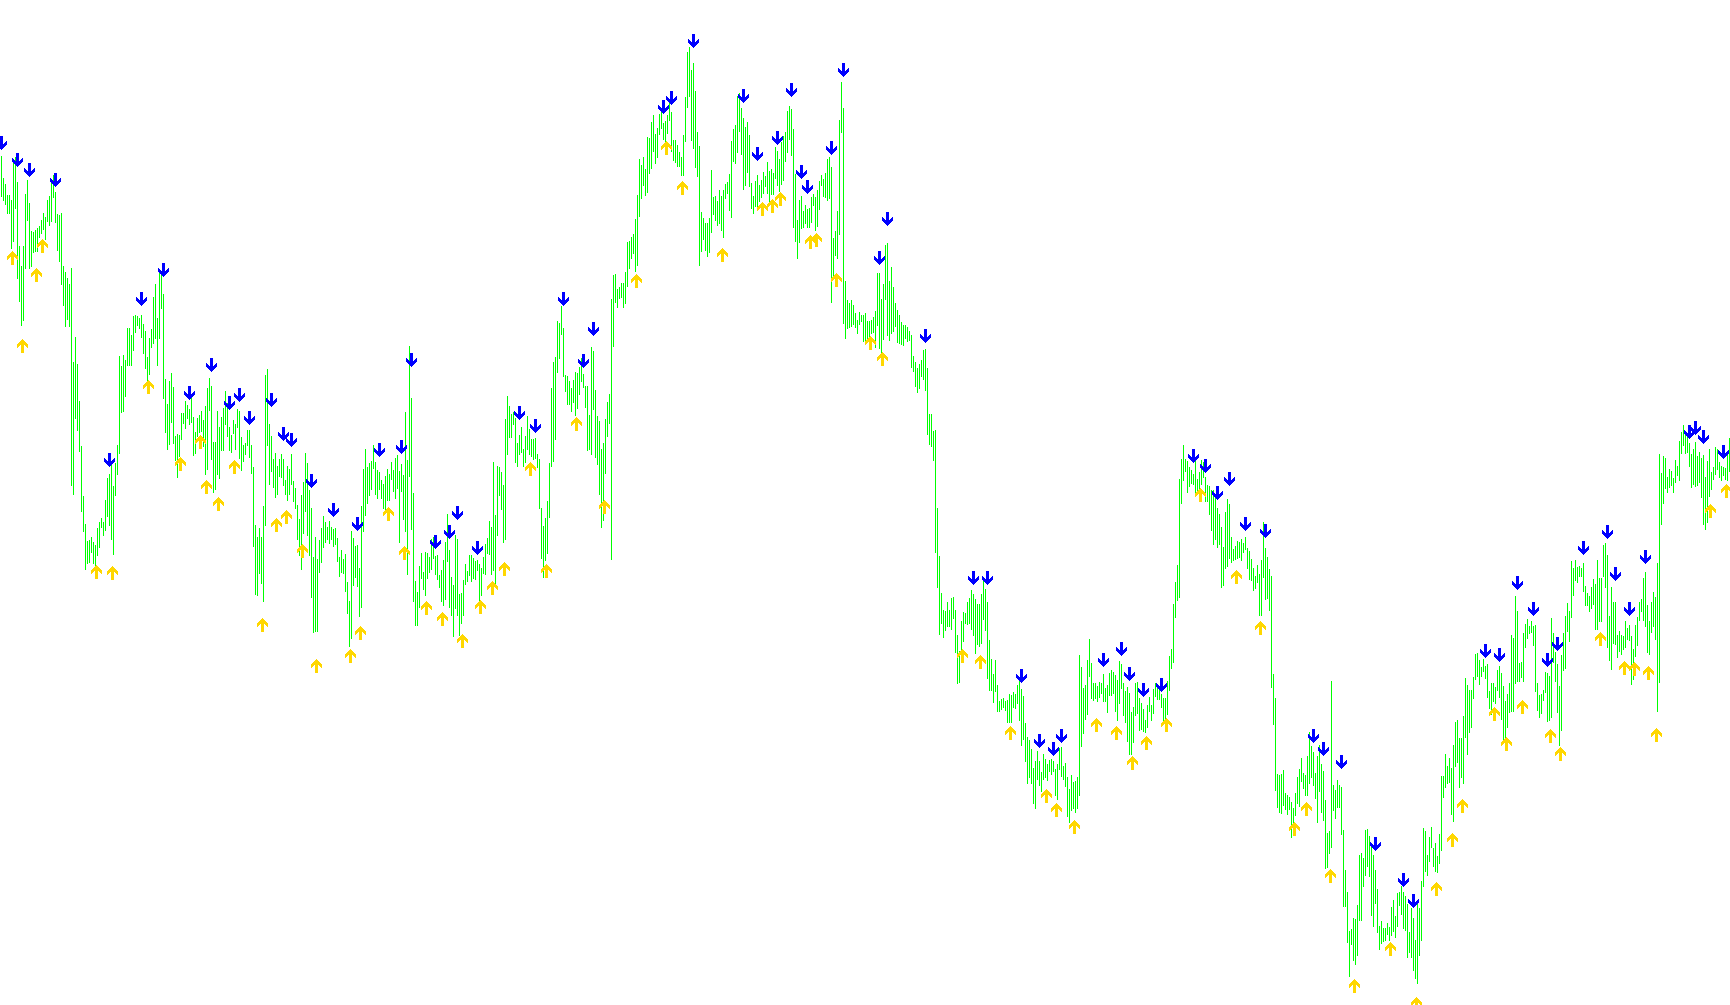
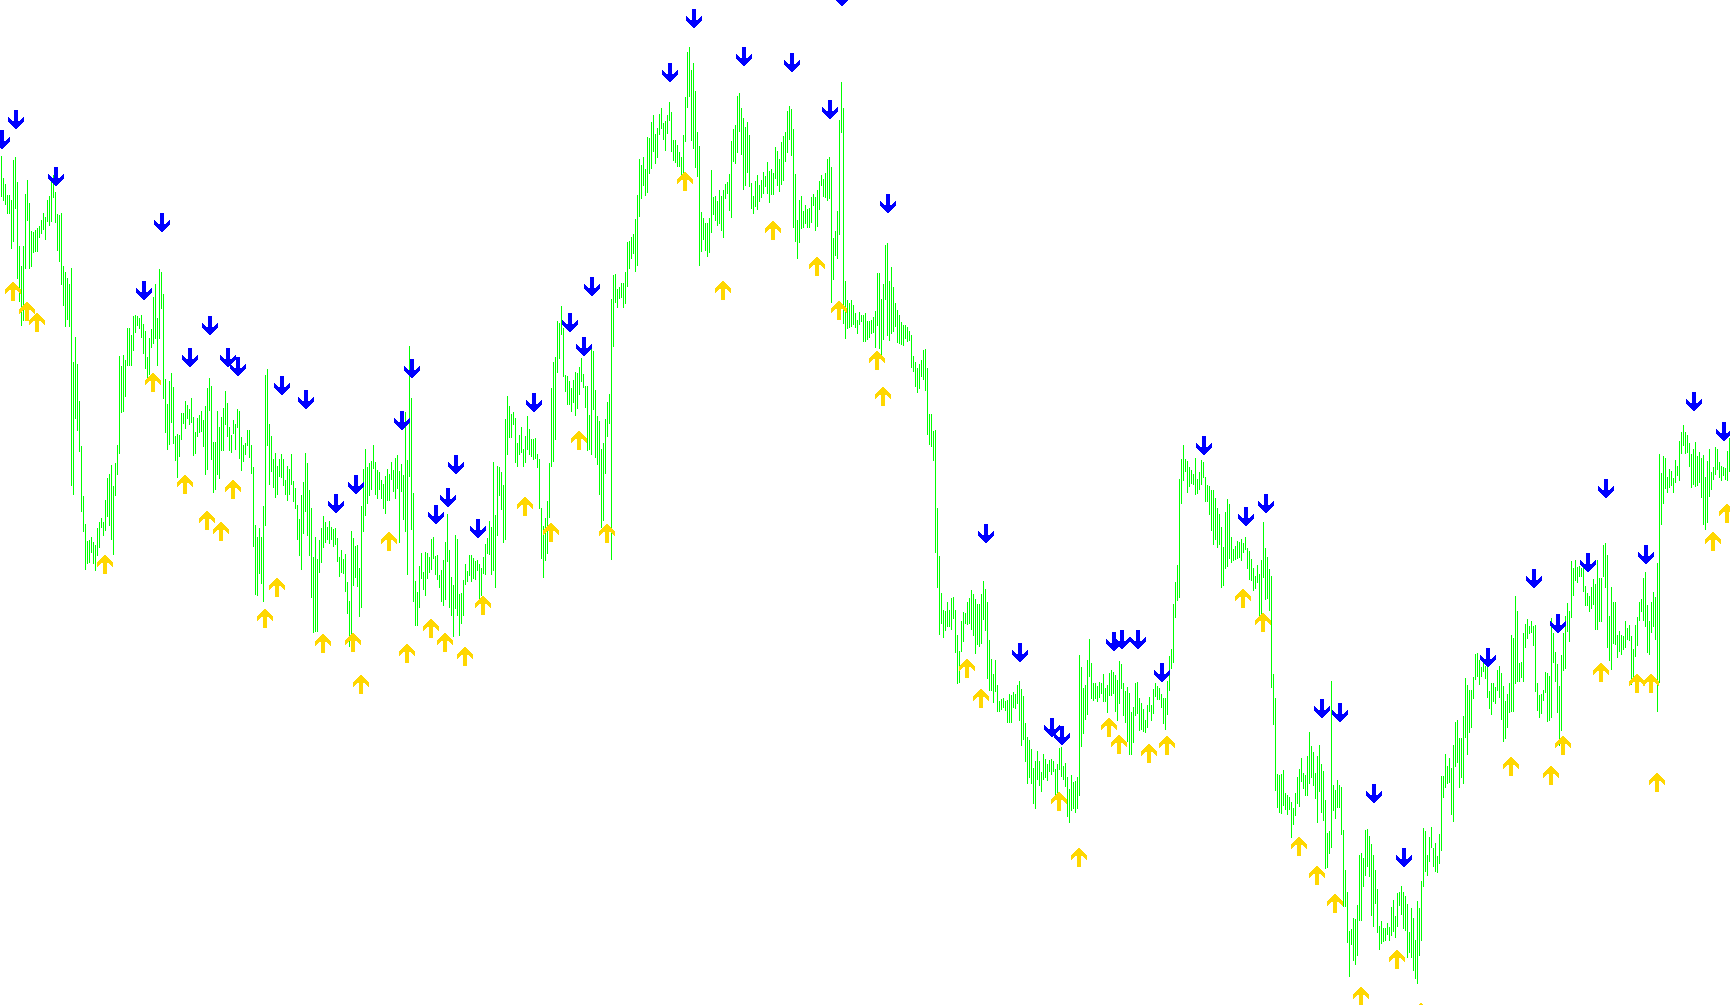
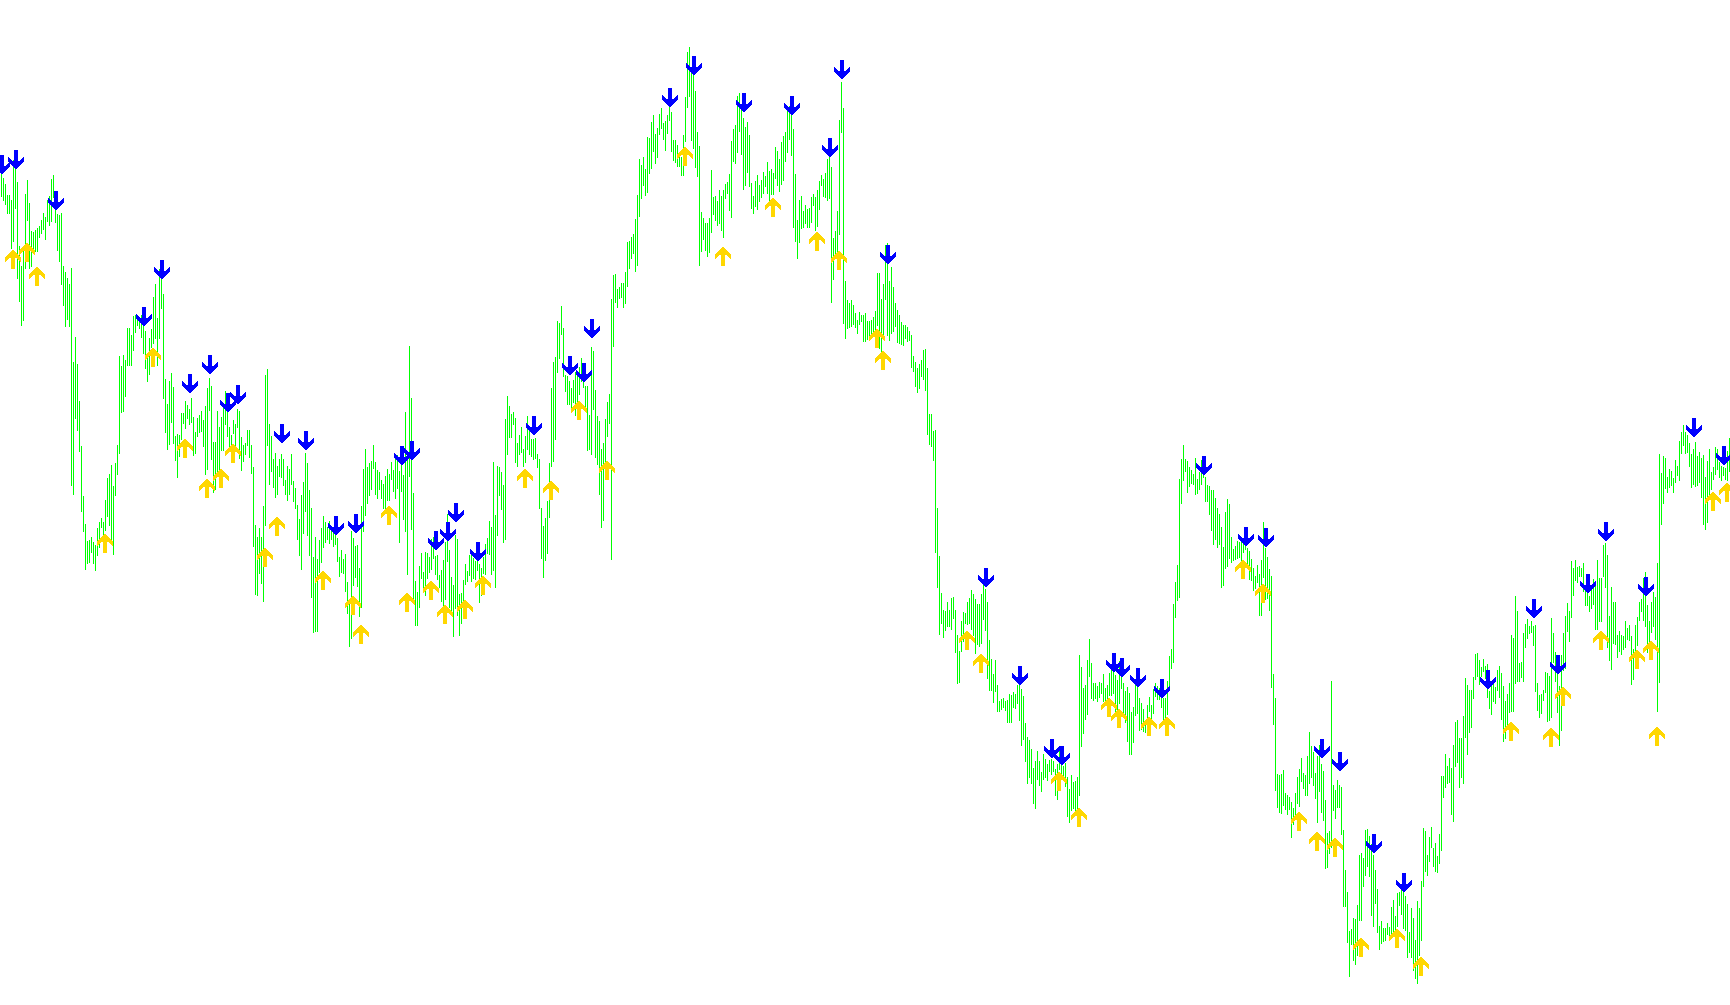
This indicator applies a logarithmic transformation to price extremes to normalize oscillations, enhancing the identification of momentum reversals and overextended price action.

ELabunskyVolaPresser
Indicator

ELabunskyVolaPresser

iMA

This indicator detects bullish and bearish entries by comparing the magnitude of exponential moving average price deviations against multi-layered speed filters.

Elder Impulse Candle Color
Indicator

Elder Impulse Candle Color

iMACDiMA

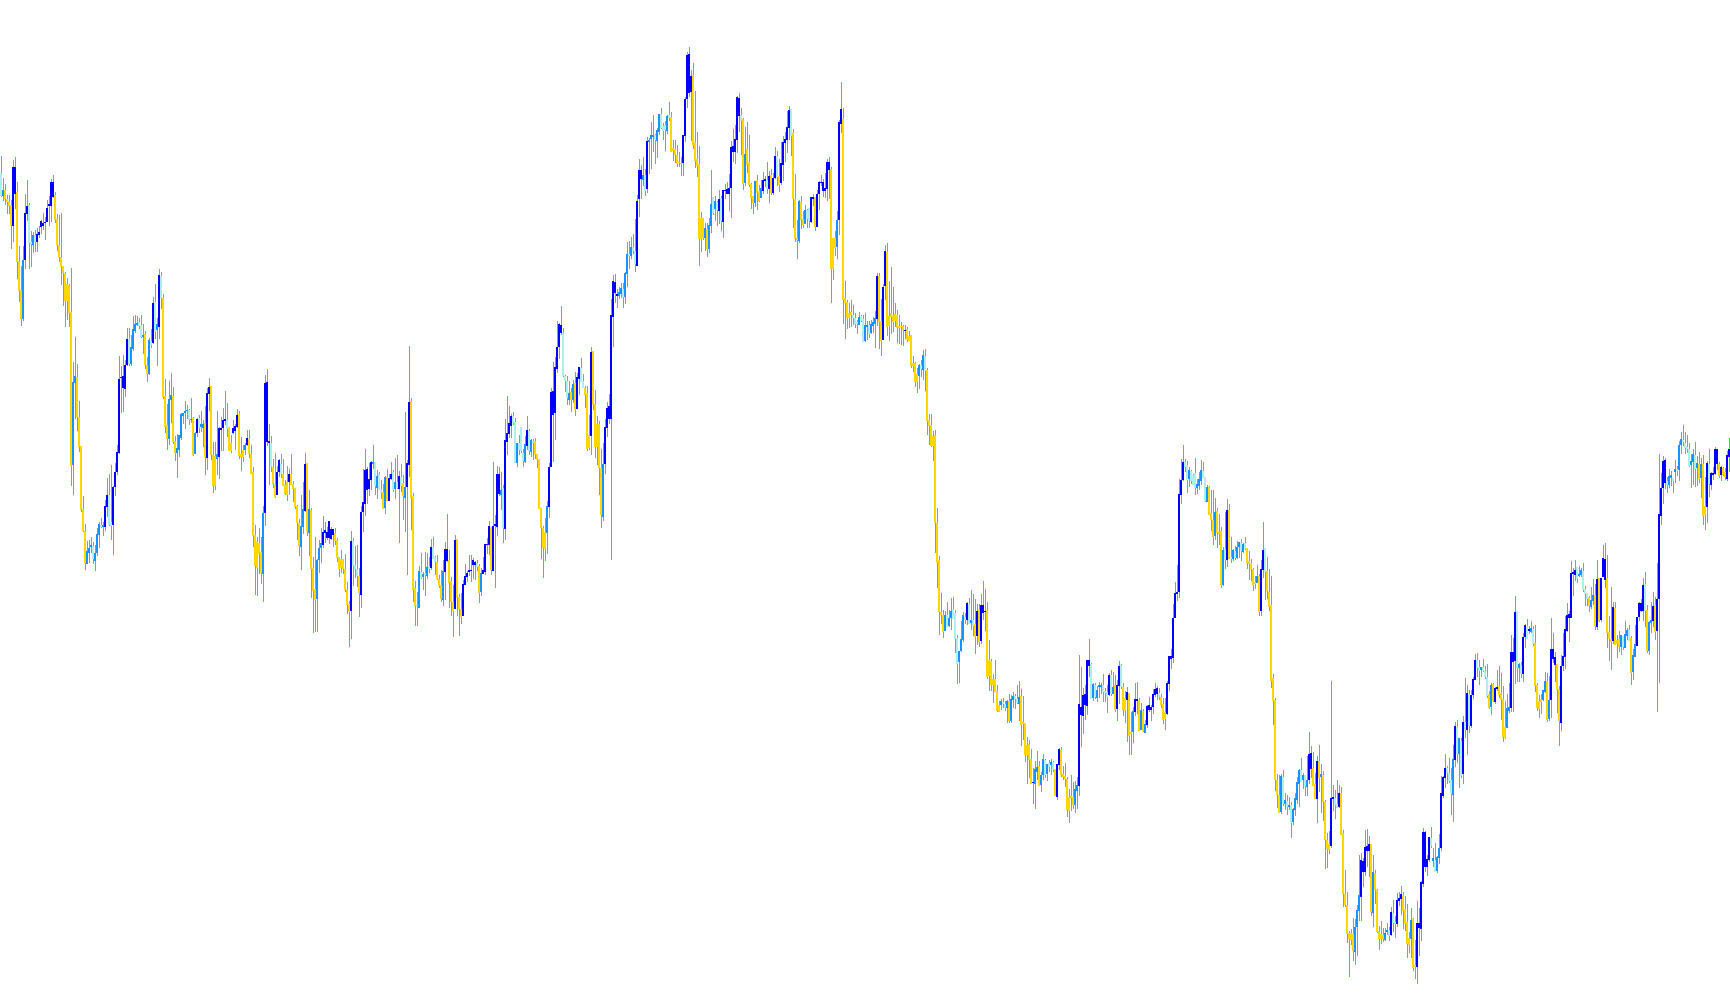
This indicator visualizes price action by overlaying Heiken Ashi candles that undergo dynamic color shifts based on the simultaneous directional alignment of Exponential Moving Averages and MACD momentum.

Elder Impulse Candle Color1
Indicator

Elder Impulse Candle Color1

iMACDiMA

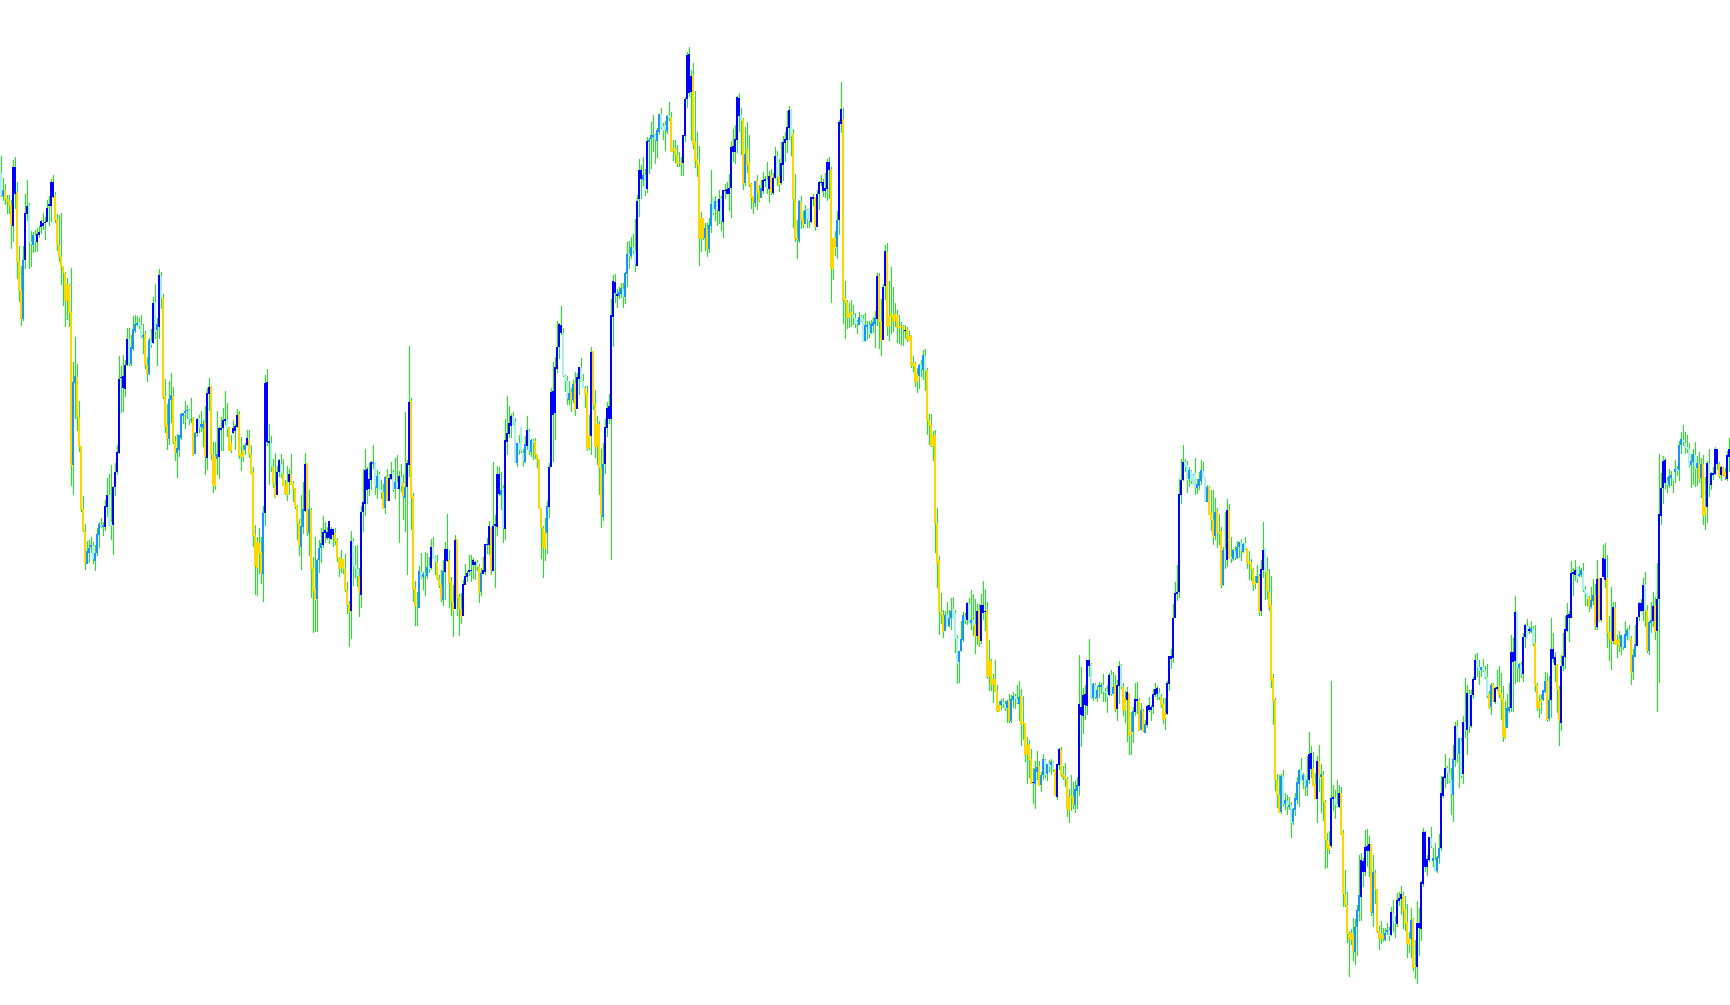
This indicator filters price action by dynamically coloring Heiken Ashi bars based on the convergence of Exponential Moving Average slopes and MACD histogram momentum.

Elder Impulse Candle Color_v1
Indicator

Elder Impulse Candle Color_v1

iMACDiMA

This indicator dynamically colors price bars based on the synchronized alignment of Exponential Moving Average trends and MACD momentum shifts.

EldersSafeZone
Indicator

EldersSafeZone

iMA

This indicator calculates a trailing safety threshold by factoring in historical price excursions and EMA trend direction to identify potential reversal zones.

EldersSafeZone_v1
Indicator

EldersSafeZone_v1

iMA

This indicator calculates a reactive support/resistance threshold by aggregating historical price fluctuations over a sliding window and applying a multiplier against an exponential moving average trend.

EldersSafeZone_v2
Indicator

EldersSafeZone_v2

iMA

This indicator calculates a trailing safety threshold by quantifying average price excursions over a fixed lookback period and weighting them against exponential moving average momentum.

Elder_Impulse_MTF
Indicator

Elder_Impulse_MTF

iMACDiMA

This indicator identifies trend alignment by correlating the directional slope of an Exponential Moving Average with the momentum shifts from a MACD calculation.

Elder_Impulse_MTF1
Indicator

Elder_Impulse_MTF1

iMACDiMA

This indicator identifies price trend synchronization by categorizing market momentum into distinct bullish, bearish, or neutral states based on the concurrent directional alignment of EMA slopes and MACD histogram dynamics.

Elder_Impulse_System
Indicator

Elder_Impulse_System

iMA

This indicator identifies directional market strength by synchronizing the upward/downward trajectory of a 13-period Exponential Moving Average with the momentum shifts of the MACD Histogram.

Elder_Impulse_System_v1
Indicator

Elder_Impulse_System_v1

iMA

This indicator identifies directional strength by synchronizing the ascending/descending slopes of a 13-period Exponential Moving Average with the MACD Histogram momentum.

Indicator

Elliott Wave indic

iBearsPoweriBullsPoweriCCIiRSI
Indicator

Elliott Wave indic_v1

iBearsPoweriBullsPoweriCCIiRSI
Elliott Wave Oscillator
Indicator

Elliott Wave Oscillator

iMA

This indicator calculates the spread between two Simple Moving Averages to identify directional shifts and trigger alerts when specific momentum thresholds are breached.

Elliott Wave Oscillator34
Indicator

Elliott Wave Oscillator34

iMA

This indicator quantifies price velocity by calculating the instantaneous difference between short-term and long-term simple moving averages based on median prices.

Elliott Wave Oscillator34_v1
Indicator

Elliott Wave Oscillator34_v1

iMA

This indicator quantifies price momentum by calculating the differential between short-term and long-term simple moving averages to visualize trend strength.

Elliott Wave Oscillator_v1
Indicator

Elliott Wave Oscillator_v1

iMA

This indicator quantifies the distance between short-term and long-term simple moving averages calculated on median prices to visualize trend velocity.

Elliott Wave Oscillator_v2
Indicator

Elliott Wave Oscillator_v2

iMA

Quantifies price velocity by calculating the arithmetic divergence between a short-term and long-term simple moving average based on median prices.

Elliott Wave Oscillator_v3
Indicator

Elliott Wave Oscillator_v3

iMA

This indicator calculates the instantaneous difference between two Simple Moving Averages of varying lengths to visualize relative price velocity and trend momentum.

Indicator

Elliott Wave Trend

iMA
Indicator

Elliott Wave Trend_v1

iMA
Indicator

Elliott_Wave_Oscillator-Arrows

iMAiMAOnArray
Indicator

Elliott_Wave_Oscillator-signal

iMAiMAOnArray
Elliott_Wave_Oscillator
Indicator

Elliott_Wave_Oscillator

iMA

This indicator quantifies price velocity by calculating the divergent spread between short-term and medium-term moving averages to visualize trend strength.

Elliott_Wave_Oscillator_v1
Indicator

Elliott_Wave_Oscillator_v1

iMA

Quantifies short-term price velocity relative to long-term equilibrium by calculating the arithmetic difference between 5-period and 35-period simple moving averages.

EM12-21-89
Indicator

EM12-21-89

iMA

This indicator identifies bullish and bearish market entries by detecting precise crossover events between short-term and long-term exponential moving averages while incorporating a volatility-based price buffer.

EM12-21
Indicator

EM12-21

iMA

This indicator identifies bullish and bearish trend shifts by detecting the specific point where a fast Exponential Moving Average crosses a slower moving average, adjusted for localized price volatility.

em12
Indicator

em12

iMA

This indicator identifies precise momentum shifts by detecting the specific candles where a fast exponential moving average pierces a slow moving average, plotting visual markers based on localized volatility ranges.

EMA Cross Arrow
Indicator

EMA Cross Arrow

iMA

This indicator identifies and plots distinct visual markers at the precise coordinates where two Exponential Moving Averages intersect to highlight momentum shifts.

ema cross bar
Indicator

ema cross bar

iMA

This indicator visualizes trend dominance by plotting dynamic histogram bars that switch vertical orientation based on the relative position of fast and slow exponential moving averages.

ema cross
Indicator

ema cross

iMA

Identifies instantaneous momentum shifts by detecting consecutive price trend inversions between 5 and 6 period exponential moving averages.

EMA Crossover Signal+Email
Indicator

EMA Crossover Signal+Email

iMA

This indicator identifies bullish and bearish trend shifts by detecting precise intersection points between two exponential moving averages and broadcasting real-time alerts via audio and email.

EMA Crossover Signal+Email_001
Indicator

EMA Crossover Signal+Email_001

iMA

This indicator identifies precise bullish and bearish momentum shifts by detecting the intersection of two distinct Exponential Moving Averages and providing real-time auditory and electronic notifications.

EMA Crossover Signal+Email_002
Indicator

EMA Crossover Signal+Email_002

iMA

Identifies bullish and bearish trend shifts by detecting precise crossovers between two exponential moving averages and triggering real-time auditory and electronic notifications.

EMA CROSSOVER SIGNAL
Indicator

EMA CROSSOVER SIGNAL

iMA

This indicator detects specific intersection points where a faster Linear Weighted Moving Average pierces a slower one, plotting visual markers based on localized volatility ranges.

EMA Crossover SignalNag
Indicator

EMA Crossover SignalNag

iMA

This indicator detects dynamic momentum shifts by identifying precise crossover points between two configurable exponential moving averages and provides real-time auditory alerts.

EMA CROSSOVER SIGNAL_v1
Indicator

EMA CROSSOVER SIGNAL_v1

iMA

Identifies precise trend reversals by detecting the crossover of two Linear Weighted Moving Averages and plotting visual signals based on calculated volatility range.

EMA Crossover Signal_v2
Indicator

EMA Crossover Signal_v2

iMA

This indicator identifies instantaneous trend shifts by detecting specific price action pivots where a fast exponential moving average intersects a slow one.

Ema Open-Close Cross
Indicator

Ema Open-Close Cross

iMA

This indicator detects bullish and bearish trend reversals by identifying instantaneous intersections between an Exponential Moving Average based on closing prices and another based on opening prices.

EMA-alert and email alert
Indicator

EMA-alert and email alert

iMA

Triggers real-time notifications when market price converges within a specified pip threshold of the Exponential Moving Average.

EMA-alert_001
Indicator

EMA-alert_001

iMA

Triggers real-time notifications when market price breaches a specified pip threshold relative to the moving average.

EMA-Crossover_Signal
Indicator

EMA-Crossover_Signal

iMA

Identifies specific price action inflection points by detecting immediate structural shifts between two distinct exponential moving average trajectories.

EMA-Crossover_Signal_001
Indicator

EMA-Crossover_Signal_001

iMA

This indicator identifies precise visual intersection points where short-term exponential moving averages pivot relative to one another, highlighting trend transitions with dynamic volatility-based spacing.

EMA-Crossover_Signal_002
Indicator

EMA-Crossover_Signal_002

iMA

This indicator identifies precise price action pivot points by detecting bullish and bearish momentum shifts where two exponential moving averages intersect.
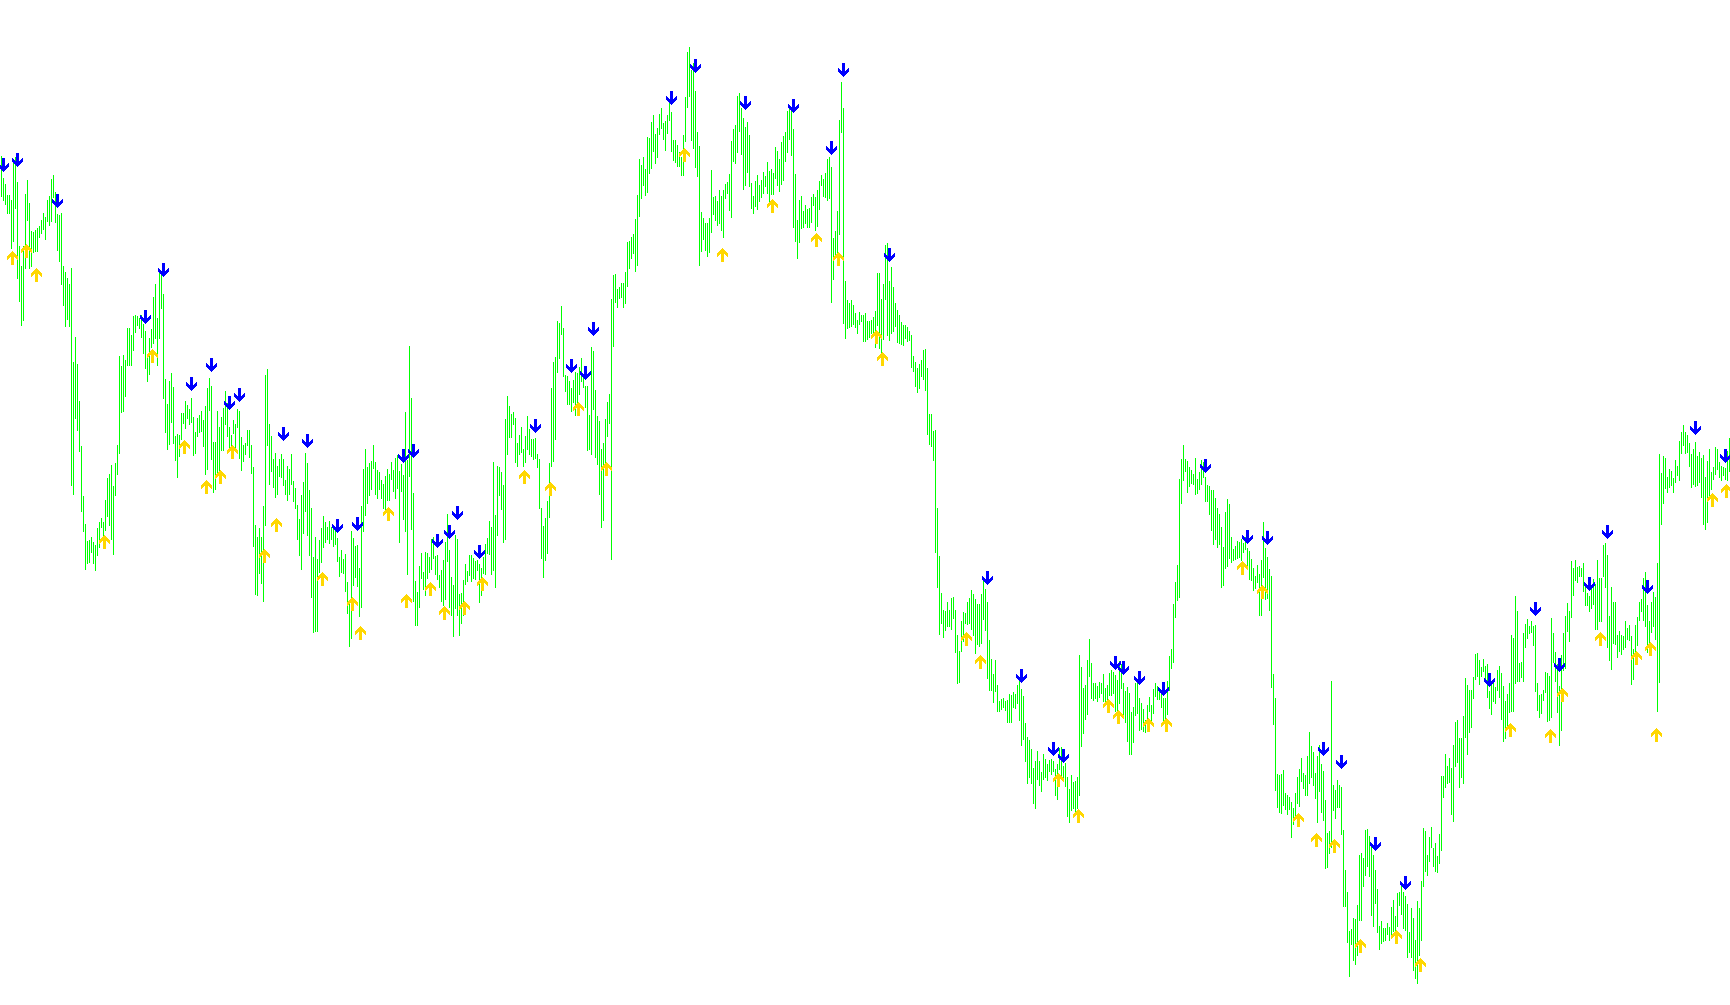
EMA-Crossover_Signal_alert
Indicator

EMA-Crossover_Signal_alert

iMA

This indicator identifies trend reversals by detecting precise crossover points between two exponential moving averages and plotting visual signals based on relative price volatility.

EMA-Crossover_Signal_v1
Indicator

EMA-Crossover_Signal_v1

iMA

This indicator identifies precise bullish and bearish trend shifts by detecting the momentary intersection of two exponential moving averages and plotting directional arrows based on price volatility.

Indicator

EMA-Crossover_Signal_v2

iMA
EMA-cross_Signal
Indicator

EMA-cross_Signal

iMA

This script identifies precise trend reversals by detecting instantaneous velocity shifts between two distinct exponential moving averages while calculating localized price volatility to plot visual anchors.

EMA4hon
Indicator

EMA4hon

iMA

This indicator identifies bullish and bearish momentum shifts by detecting the specific intersection of fast Exponential Moving Averages with slower period anchors, complemented by volume-filtered alerts.