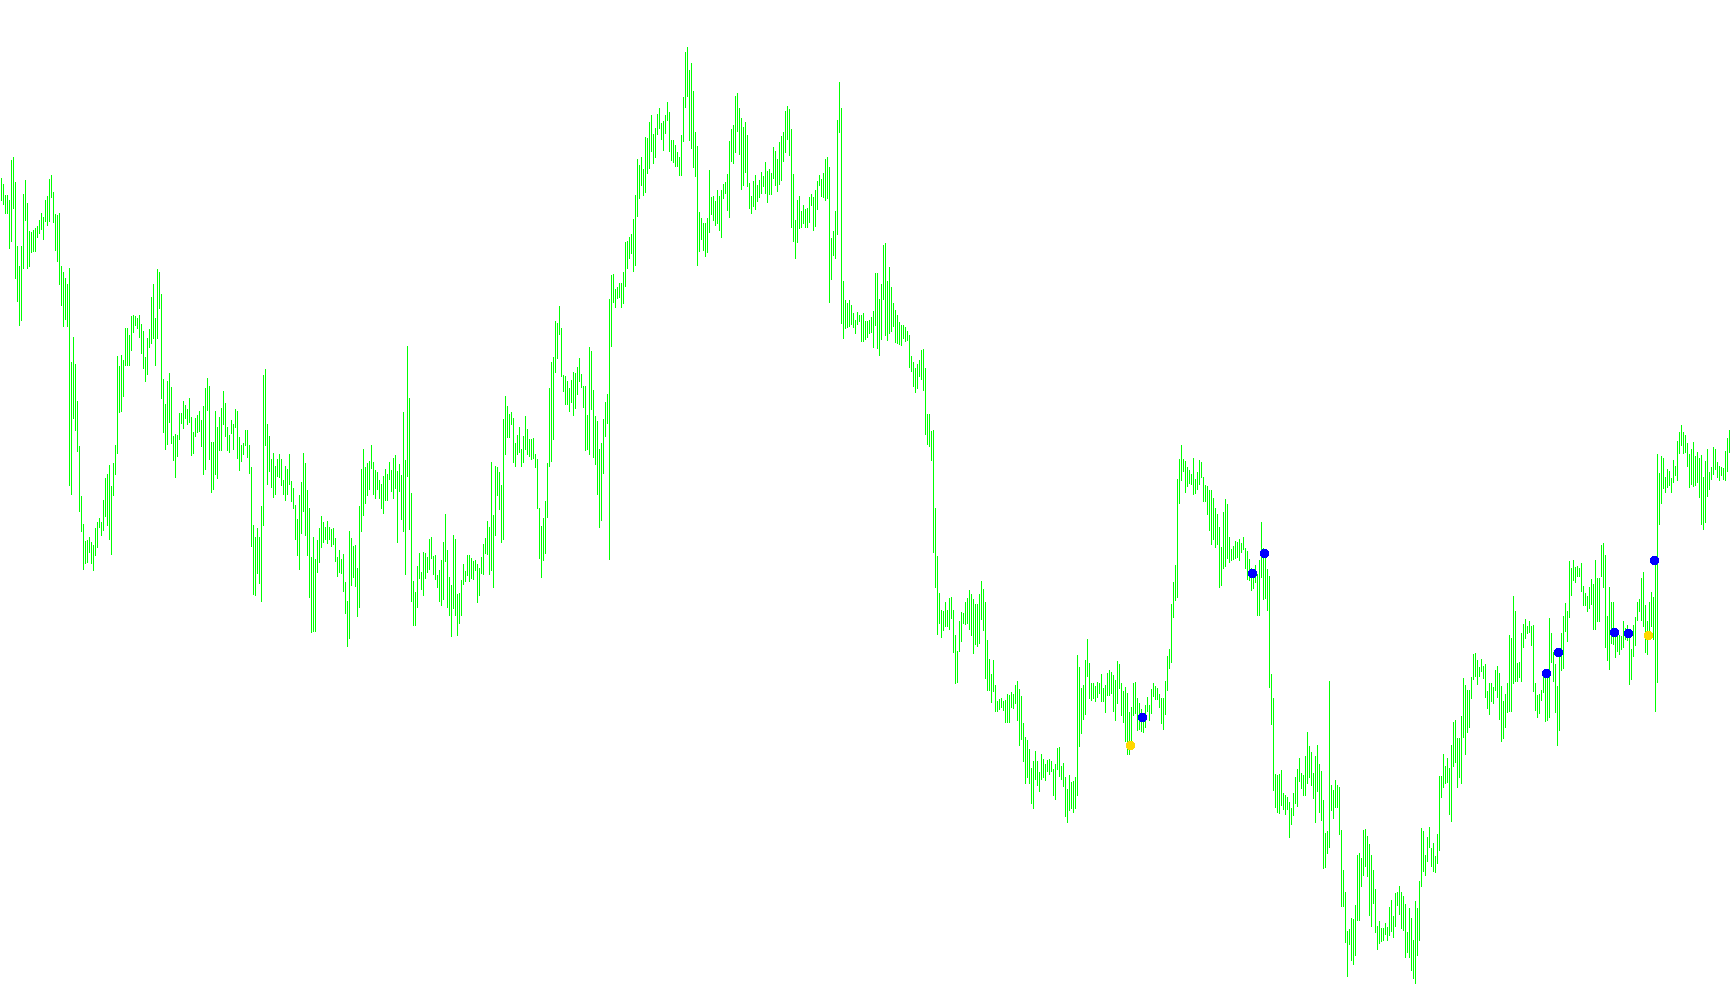
EMA_Trend_Indicator_v1
Indicator

EMA_Trend_Indicator_v1

iMA

This indicator visualizes trend dynamics by mapping twin Exponential Moving Averages across both high and low price extremes to identify structural momentum.

EMA_Trend_Indicator_v2
Indicator

EMA_Trend_Indicator_v2

iMA

This indicator visualizes market direction by calculating and plotting dual exponential moving averages based on both high and low price action to identify trend momentum.

EntropyMath_ofMA
Indicator

EntropyMath_ofMA

iMA

This indicator quantifies market disorder by calculating the Shannon entropy of logarithmic returns derived from smoothed moving average price points.

envelope alert
Indicator

envelope alert

iEnvelopesiMA

This indicator monitors real-time price action to trigger instant alerts and emails whenever the current bid enters a specific point-based tolerance zone around the moving average, upper envelope, or lower envelope.

Envelopes
Indicator

Envelopes

iMA

This indicator calculates linear boundaries by applying a fixed percentage deviation from a standard moving average to identify price extremes.

Epsilon
Indicator

Epsilon

iMA

This indicator calculates a daily reset Exponential Moving Average and projects upper and lower percentage boundaries to define a volatility-based price channel.

eSignal
Indicator

eSignal

iMACDiMA

This indicator identifies directional momentum by synchronizing the trajectory of Exponential Moving Averages with MACD histogram shifts across multiple timeframes.

eur_V_usd2
Indicator

eur_V_usd2

iMA

This indicator calculates and visualizes the relative momentum variance between a multi-currency Euro basket and a diverse US Dollar basket using weighted SMA deviations.

eur_V_usd2_001
Indicator

eur_V_usd2_001

iMA

This indicator calculates a weighted momentum divergence between the Euro-centric and US Dollar-centric currency baskets to identify relative strength shifts.

ew1
Indicator

ew1

iMA

This indicator identifies trend reversals by calculating the relative extrema of the difference between fast and slow Simple Moving Averages based on median price.

ew1_v1
Indicator

ew1_v1

iMA

This indicator identifies directional shifts by comparing the current spread of short-term and long-term median moving averages against a defined historical peak-to-valley threshold.

EWO
Indicator

EWO

iMA

This indicator quantifies trend momentum by calculating the numerical spread between a short-term 5-period and a long-term 35-period Simple Moving Average based on median prices.

EWOCCI_Indicator.2
Indicator

EWOCCI_Indicator.2

iCCIiMA

This indicator generates buy/sell signals based on the crossover of the CCI around zero and the sign of the Elliot Wave Oscillator (EWO), signaling potential trend changes.

EWOCCI_Indicator.2_v1
Indicator

EWOCCI_Indicator.2_v1

iCCIiMA

This indicator identifies high-probability trend reversals by detecting concurrent momentum shifts between the Elliot Wave Oscillator (EWO) and the Commodity Channel Index (CCI) filtered by daily price pivots.

EWOCCI_Indicator
Indicator

EWOCCI_Indicator

iCCIiMA

This indicator identifies trend reversals by detecting simultaneous zero-crossings in the Commodity Channel Index and the Elliot Wave Oscillator while filtering for momentum via moving average spreads.

EWOCCI_Indicator_v1
Indicator

EWOCCI_Indicator_v1

iCCIiMA

This indicator identifies potential reversals by detecting simultaneous zero-crossings of the Commodity Channel Index (CCI) and the Elliot Wave Oscillator (EWO), filtered by momentum divergence.

Execute Line Build 205 Ok
Indicator

Execute Line Build 205 Ok

iMAiMAOnArray

This indicator identifies directional momentum by applying a secondary moving average over a Hull Moving Average derived vector to highlight distinct bullish and bearish trend segments.

Execute Line
Indicator

Execute Line

iMAiMAOnArray

This indicator calculates a Hull Moving Average to identify momentum shifts and visualize distinct directional trend transitions through price velocity smoothing.

Execute Linesw Alert
Indicator

Execute Linesw Alert

iMAiMAOnArray

This indicator calculates the momentum differential between two weighted moving averages of varying lengths to identify structural trend shifts and price velocity.

Execute Linesw Alert_001
Indicator

Execute Linesw Alert_001

iMAiMAOnArray

This indicator identifies directional shifts by calculating a smoothed differential between two weighted moving averages to isolate underlying momentum trends.

Execute Linesw-1(Alert)
Indicator

Execute Linesw-1(Alert)

iMAiMAOnArray

This indicator calculates a secondary vector derived from the differential of two weighted moving averages to identify trend shifts and signal momentum reversals.

Execute Linesw-1(Alert)_001
Indicator

Execute Linesw-1(Alert)_001

iMAiMAOnArray

This indicator calculates a synthetic momentum vector by subtracting long-period weighted moving averages from doubled short-period averages, then applies a secondary smoothing pass to isolate trend reversals.

Execute Linesw
Indicator

Execute Linesw

iMAiMAOnArray

This indicator calculates a synthetic vector by subtracting long-period weighted moving averages from twice the short-period values to identify directional shifts and trend transitions.

Execute Linesw_001
Indicator

Execute Linesw_001

iMAiMAOnArray

This indicator identifies directional shifts by applying a square root smoothing algorithm to the differential of dual weighted moving averages.

ExpertCLOR_2MA&StATR_v01
Indicator

ExpertCLOR_2MA&StATR_v01

iMA

An automated trade management utility that dynamically adjusts stop-loss levels based on ATR volatility, executes break-even transitions at specific point thresholds, and monitors moving average crossovers for exit signals.

F2a_AO_comm_alert
Indicator

F2a_AO_comm_alert

iMAiMAOnArray

Identifies trend reversals by detecting divergent momentum shifts between fast and slow moving averages applied to customized price smoothing algorithms.

FanSimple4en
Indicator

FanSimple4en

iMA

This indicator synchronizes multiple Exponential Moving Averages across various timeframes to visualize trend convergence and price positioning relative to the moving average stack.

FanSimple4en_001
Indicator

FanSimple4en_001

iMA

This indicator monitors the synchronized trend direction of multiple Exponential Moving Averages across several concurrent timeframes to identify global price momentum and positional bias.

FanSimple8-1bEn
Indicator

FanSimple8-1bEn

iMA

This indicator visualizes price action relative to a series of moving averages across multiple concurrent timeframes to identify trend synchronization.

FanSimple8-1bEnL
Indicator

FanSimple8-1bEnL

iMA

This indicator visualizes a tiered set of moving averages across multiple timeframes to determine trend alignment and price positioning relative to momentum layers.

FanSimple8
Indicator

FanSimple8

iMA

This indicator evaluates the alignment of multiple Exponential Moving Averages across various timeframes to determine bullish or bearish trend consistency and price relative position.

Indicator

FanSimple8YZst

iMAiStochastic
FanSimple8_4MEn
Indicator

FanSimple8_4MEn

iMA

This indicator synchronizes multiple moving averages across various timeframes to visualize price alignment and trend momentum through a hierarchical fan system.

FanSimple8_4MEn_v1
Indicator

FanSimple8_4MEn_v1

iMA

This indicator synchronizes multiple moving average sequences across various timeframes to visually map price alignment and trend directionality simultaneously.

FanSimple8_mEn
Indicator

FanSimple8_mEn

iMA

This indicator synchronizes multiple moving averages across diverse timeframes to visualize price orientation and trend alignment through a dynamic geometric fan layout.

Fast - MACD
Indicator

Fast - MACD

iMAiMAOnArray

This indicator calculates a dual-layered MACD variance using EMA crossovers and SMA smoothing with customizable visual logic for zero-crossings or momentum shifts.

Fast&Slow&SAR
Indicator

Fast&Slow&SAR

iMAiSAR

This indicator identifies high-probability reversals by synchronizing Exponential Moving Average crossovers with Parabolic SAR trend violations and EMA distance filtering.

FDM ADR
Indicator

FDM ADR

iMA

This indicator calculates and displays the Average Daily Range (ADR) across multiple historical periods—specifically 1, 5, 10, and 20 days—while simultaneously computing potential price 'rooms' based on user-defined risk-to-reward ratios.

FDM Buy Sell Pressure #2
Indicator

FDM Buy Sell Pressure #2

iMA

This indicator visualizes dynamic price action by plotting histograms and lines based on the relative position of the current market price against both a standard EMA and a Linear Stochastic Moving Average.

FDM Buy Sell Pressure
Indicator

FDM Buy Sell Pressure

iMA

This indicator identifies market sentiment by visualizing price deviations relative to both a standard exponential moving average and a linear weighted momentum calculation.

FDM Entry Arrows with Alerts
Indicator

FDM Entry Arrows with Alerts

iMA

Identifies potential trend reversals by detecting specific directional crossovers between fast and slow exponential moving averages accompanied by volatility-based price displacement.

FDM Support and Resistance
Indicator

FDM Support and Resistance

iMA

This indicator identifies price momentum shifts where candle closures cross a 10-period Simple Moving Average to dynamically plot Fibonacci retracement zones based on recent swing highs and lows.

FerruFx_Multi_info THV
Indicator

FerruFx_Multi_info THV

iCCIiMACDiADXiMA
FerruFx_Multi_info+
Indicator

FerruFx_Multi_info+

iCCIiMACDiADXiMA

This indicator synthesizes real-time trend data from moving averages, CCI, MACD, ADX, and Bulls/Bears power across multiple timeframes to provide a comprehensive visual heat map of market sentiment and trade statistics.

FerruFx_Multi_info+_light_chart_v1.1
Indicator

FerruFx_Multi_info+_light_chart_v1.1

iCCIiMACDiADXiMA
FerruFx_Multi_info+_light_chart_v1.1_001
Indicator

FerruFx_Multi_info+_light_chart_v1.1_001

iCCIiMACDiADXiMA
FerruFx_Multi_info+_light_chart_v1[1].1-Ndisc
Indicator

FerruFx_Multi_info+_light_chart_v1[1].1-Ndisc

iCCIiMACDiADXiMA
FerruFx_Multi_info+_v1[1].2
Indicator

FerruFx_Multi_info+_v1[1].2

iCCIiMACDiADXiMA

This indicator provides a customizable dashboard displaying account information and aggregated trend analysis from multiple indicators across various timeframes, allowing traders to quickly assess market direction.

FerruFx_Multi_info__
Indicator

FerruFx_Multi_info__

iCCIiMACDiADXiMA
FerruFx_Trend+
Indicator

FerruFx_Trend+

iCCIiMACDiADXiMA

This indicator aggregates directional bias from multiple timeframes by synthesizing Moving Averages, CCI, ADX, and Bulls/Bears Power into a weighted cumulative trend score.