Indicator

EmaAlert2

iMA
EMAAngle
Indicator

EMAAngle

iMA

This indicator quantifies the directional momentum of an Exponential Moving Average by calculating the geometric slope over a specific historical shift to identify periods of low-velocity equilibrium.

EMAAngleZero
Indicator

EMAAngleZero

iMA

This indicator quantifies the velocity of Exponential Moving Averages by calculating geometric slope relative to a defined price shift, highlighting periods of stagnation near zero.

EMAAnglezeroalert for EJ_4h
Indicator

EMAAnglezeroalert for EJ_4h

iMA

This indicator quantifies the slope of an Exponential Moving Average to detect trend intensity, identifying neutral zones when the gradient falls within a specified proximity to zero.

EMAAngleZeroAlert
Indicator

EMAAngleZeroAlert

iMA

This indicator quantifies the geometric incline of an Exponential Moving Average to identify directional momentum, trend exhaustion, and neutral equilibrium points.

EMAAngleZeroAlert_v1
Indicator

EMAAngleZeroAlert_v1

iMA

This indicator calculates the gradient of the Exponential Moving Average over a specific horizontal shift to identify directional momentum or periods of price consolidation.

EMAAngleZeroDT
Indicator

EMAAngleZeroDT

iMA

This indicator quantifies the directional velocity of an Exponential Moving Average by measuring the angular variance between two distinct temporal offsets to identify trend acceleration and equilibrium zones.

EMAAngleZero_001
Indicator

EMAAngleZero_001

iMA

This indicator quantifies the directional velocity of an Exponential Moving Average by calculating the angular slope between two distinct historical points to identify trend strength or consolidation.

EmaAngleZero_modema
Indicator

EmaAngleZero_modema

iMA

This indicator quantifies the rate of change in Exponential Moving Average slope to identify trend strength and periods of horizontal price consolidation.

EMAAngleZero_v1
Indicator

EMAAngleZero_v1

iMA

This indicator quantifies the rate of change of an Exponential Moving Average to identify trend strength, momentum exhaustion near zero, and directional bias via angular thresholds.

EMAAngleZero_v3
Indicator

EMAAngleZero_v3

iMA

This indicator quantifies the directional velocity of an Exponential Moving Average by calculating its angular tilt relative to a specified historical offset.
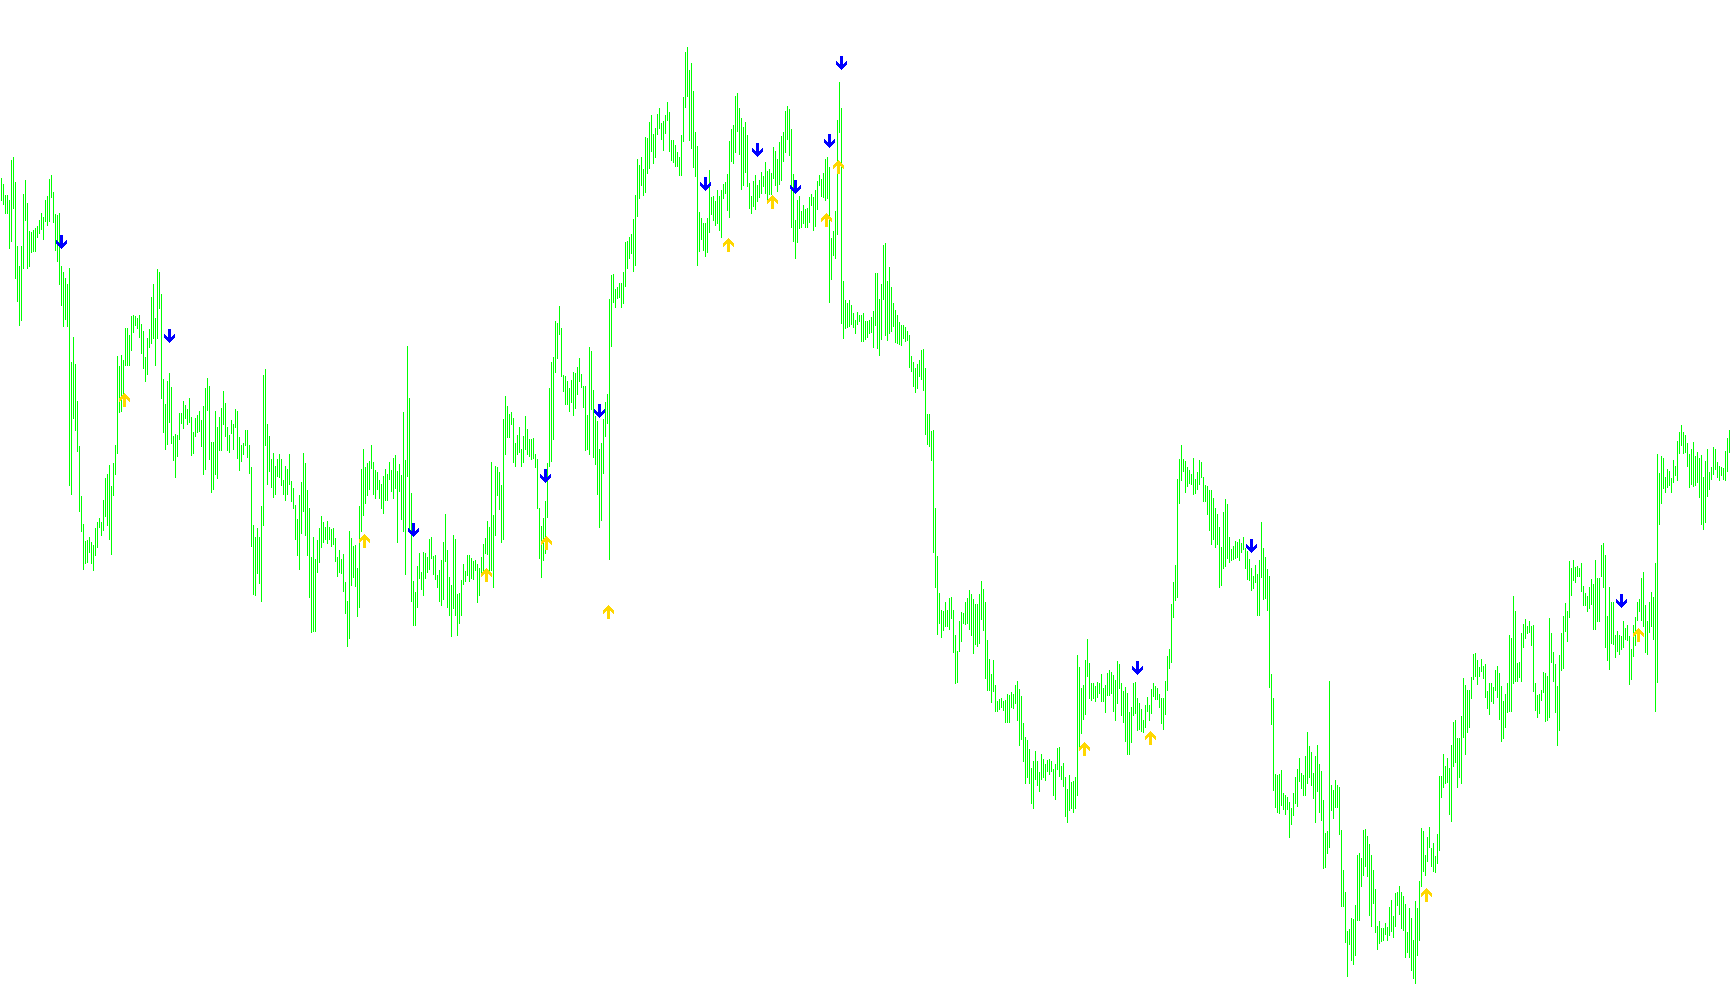
EMAAngle_v1
Indicator

EMAAngle_v1

iMA

This indicator quantifies the geometric inclination of an Exponential Moving Average to identify periods of price consolidation or aggressive trend velocity.

EMABands_v1
Indicator

EMABands_v1

iMA

This indicator maps high and low exponential moving averages with fixed-point vertical offsets to visualize price volatility boundaries.

EMABands_v1_v1
Indicator

EMABands_v1_v1

iMA

This indicator plots dual boundary channels derived from moving average deviations of high and low price extremes to identify trend corridors.

EMABands_v1_v2
Indicator

EMABands_v1_v2

iMA

This indicator plots dual upper and lower bands derived from the high/low moving averages, expanded by a fixed point offset to delineate price boundaries.

EmaCrosswithRSI3
Indicator

EmaCrosswithRSI3

iMAiRSI

This indicator identifies precise trend reversals by detecting geometric crossovers between dual Exponential Moving Averages and validating momentum shifts via Relative Strength Index (RSI) threshold breaches.

EMAdensity
Indicator

EMAdensity

iMA

Quantifies the statistical volatility and convergence of five multi-period exponential moving averages by calculating their variance relative to their collective mean.

Indicator

EMailSignals

iMAiRSI
emas
Indicator

emas

iMA

This indicator identifies bullish and bearish trend strength by measuring the sequential alignment of three distinct Exponential Moving Averages to visualize momentum shifts.

EMATrailingStop_v1
Indicator

EMATrailingStop_v1

iMA

This script dynamically adjusts trailing stop-loss levels by anchoring them to an Exponential Moving Average while maintaining a minimum required distance from the current market price.

EMATrailingStop_v1a
Indicator

EMATrailingStop_v1a

iMA

This algorithm dynamically adjusts trailing stop-loss levels by anchoring them to a shifting Exponential Moving Average while maintaining a minimum market distance threshold.

EMA_5_10_34_Signal
Indicator

EMA_5_10_34_Signal

iMA

This indicator identifies bullish and bearish momentum shifts by detecting specific crossover sequences between three distinct exponential moving averages relative to a dynamic volatility-based range.

EMA_5_10_34_Signal_v1
Indicator

EMA_5_10_34_Signal_v1

iMA

Identifies precise trend reversals by detecting the moment medium-term moving averages breach slower long-term benchmarks while synchronized with faster momentum shifts.

EMA_Angle
Indicator

EMA_Angle

iMA

This indicator quantifies the rate of change in an Exponential Moving Average by calculating its angular deviation relative to a specific price shift interval.

EMA_Angle1
Indicator

EMA_Angle1

iMA

This indicator quantifies the momentum of an Exponential Moving Average by measuring its angular trajectory to identify trend strength, stagnation, or reversal zones.

EMA_Angle_AppliedPrice_Alert
Indicator

EMA_Angle_AppliedPrice_Alert

iMA

This indicator quantifies the rate of change in an Exponential Moving Average by calculating the angular tilt between two historical points to identify trend strength or consolidation zones.

EMA_Angle_v1
Indicator

EMA_Angle_v1

iMA

This indicator quantifies the momentum of an Exponential Moving Average by calculating its angular variance between two distinct temporal shifts to identify trend strength or stagnation.

EMA_Cross-over_Alerts_v1
Indicator

EMA_Cross-over_Alerts_v1

iMA

This indicator detects precise momentum shifts by identifying the exact crossover points between two configurable moving averages and triggers visual markers alongside real-time audible or electronic notifications.

EMA_Cross-over__Alerts
Indicator

EMA_Cross-over__Alerts

iMA

This indicator identifies bullish and bearish momentum shifts by detecting specific intersection points where a fast Exponential Moving Average overtakes a slower one.

EMA_Crossover_Alert5-12
Indicator

EMA_Crossover_Alert5-12

iMA

Identifies trend reversals by detecting precise intersections between two moving averages, including Linear Scaled Moving Average (LSMA) variations with customizable price weighting and real-time audio or email notifications.

EMA_CROSSOVER_SIGNAL
Indicator

EMA_CROSSOVER_SIGNAL

iMA

This indicator identifies precise trend shifts by plotting visual markers at the exact points where a fast Linear Weighted Moving Average intersects a slower one.

Indicator

EMA_CROSS_Derk_v01

iMA
Indicator

EMA_CROSS_Derk_v02

iMA
Indicator

EMA_CROSS_Derk_v021

iMA
Indicator

EMA_CROSS_Derk_v02X

iMA
Indicator

EMA_CROSS_Derk_v03

iMA
Indicator

EMA_CROSS_Derk_v031

iMA
Indicator

EMA_CROSS_Derk_v032

iMA
Indicator

EMA_CROSS_Derk_v04

iMA
EMA_CROSS_IND
Indicator

EMA_CROSS_IND

iMA

This indicator identifies trend shifts by detecting the precise intersection of two Exponential Moving Averages and plotting directional arrows for visual confirmation.

EMA_levels
Indicator

EMA_levels

iMA

This indicator projects symmetric linear bands around an exponential moving average to visualize price deviations from the central trend.

EMA_levels_v1
Indicator

EMA_levels_v1

iMA

This indicator generates a central exponential moving average accompanied by symmetrically offset upper and lower boundaries to define a volatility-based trading zone.

EMA_Pivot
Indicator

EMA_Pivot

iMA

Identifies potential trend reversals by detecting price action deviations exceeding a specific point threshold from the 4-period Exponential Moving Average.

EMA_Prediction
Indicator

EMA_Prediction

iMA

This indicator identifies trend reversals by detecting concurrent shifts in exponential moving average alignments coupled with specific candle polarity transitions.

EMA_Prediction_2
Indicator

EMA_Prediction_2

iMA

This indicator identifies potential trend reversals by detecting momentum shifts where short-term and long-term exponential moving averages intersect, accompanied by visual confirmation signals.

EMA_Prediction_2_v1
Indicator

EMA_Prediction_2_v1

iMA

This indicator detects momentum shifts by identifying specific crossover points between short and long exponential moving averages while providing visual confirmation of price action polarity.

EMA_Prediction_v1
Indicator

EMA_Prediction_v1

iMA

This indicator identifies bullish and bearish trend reversals by detecting crossover events between fast and slow exponential moving averages combined with price candle confirmation.

EMA_RSI_Signal
Indicator

EMA_RSI_Signal

iMAiRSI

Identifies trend reversals by detecting bullish or bearish EMA crossovers filtered by RSI momentum thresholds.

ema_smma
Indicator

ema_smma

iMA

This script quantifies the price momentum delta by calculating the numerical variance between a Standard Moving Average and a dual-period Exponential Moving Average.

EMA_Trend_Indicator
Indicator

EMA_Trend_Indicator

iMA

This indicator identifies market momentum by plotting dual Exponential Moving Averages across both high and low price extremes to visualize trend boundaries.