FF Tunnel Chart
Indicator

FF Tunnel Chart

iMA

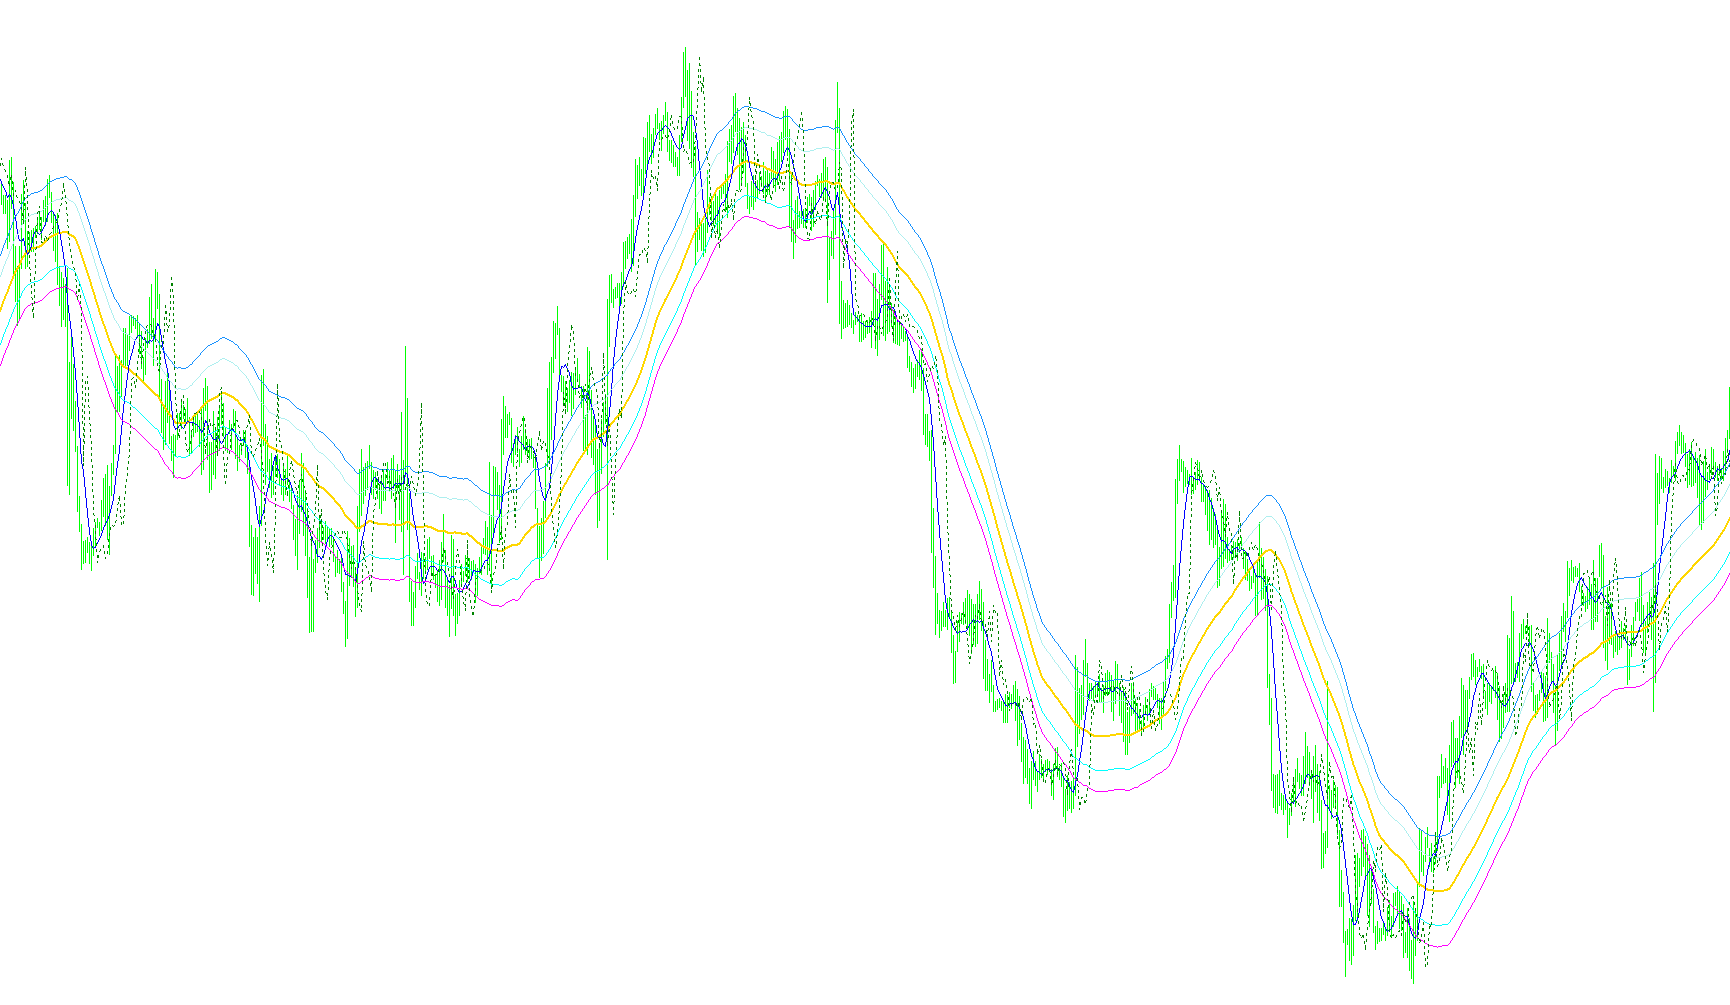
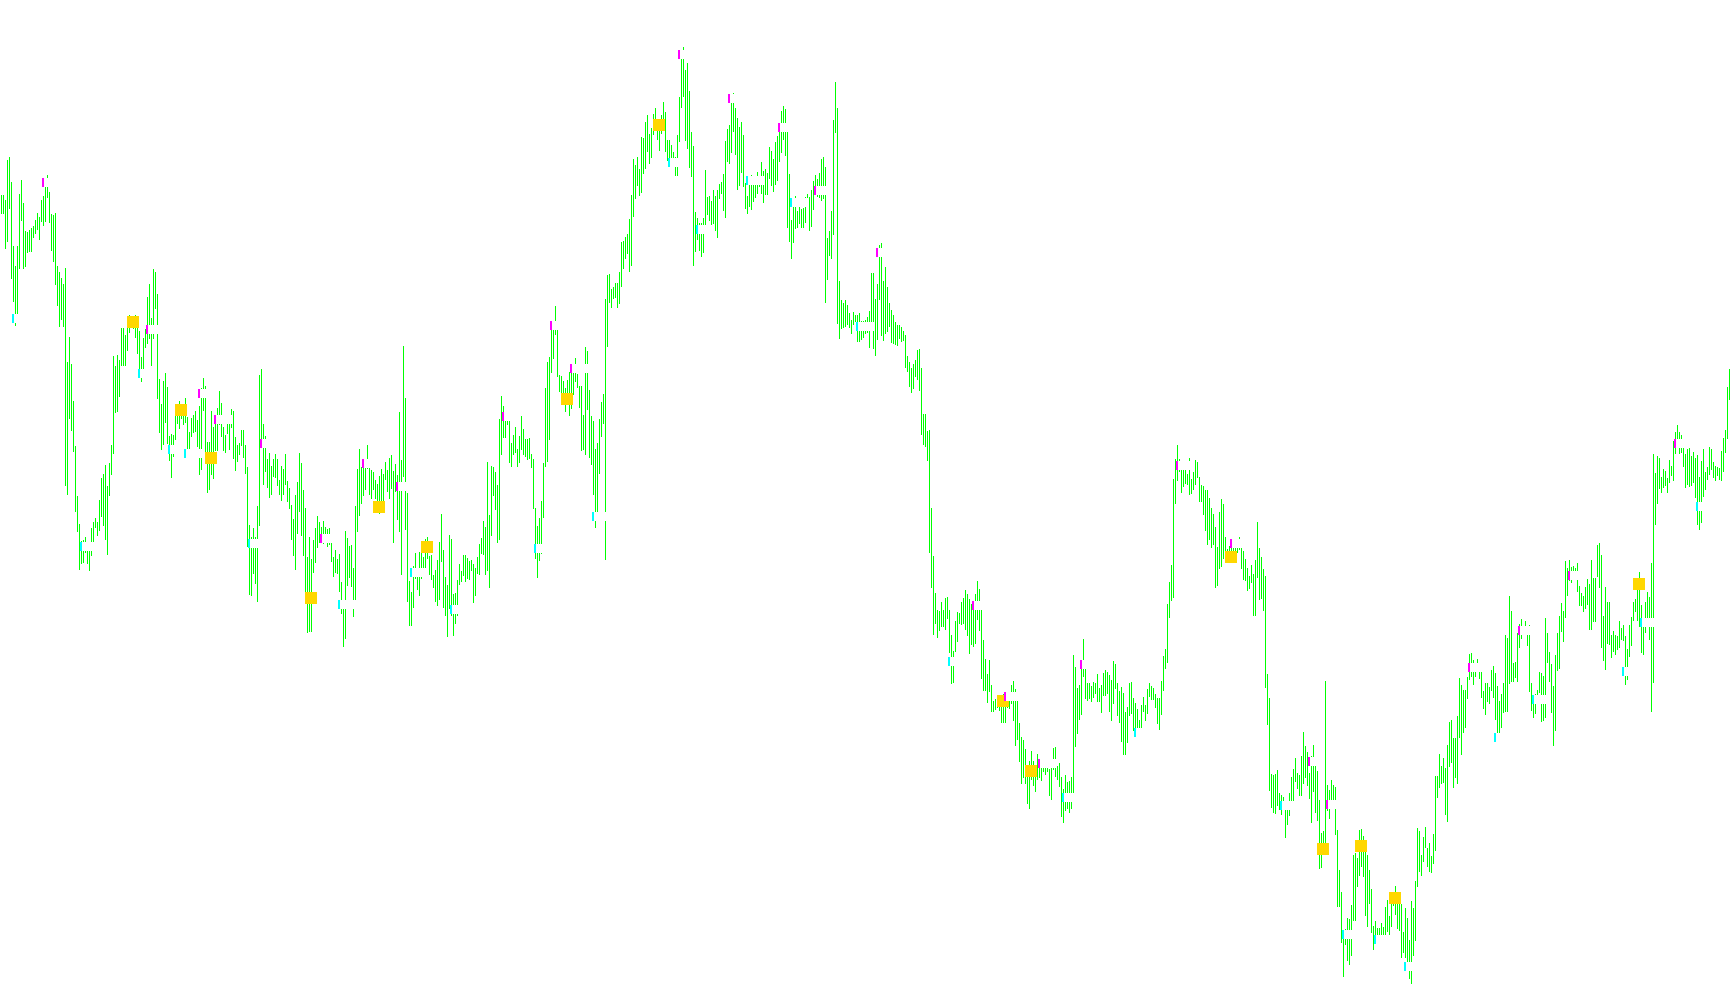
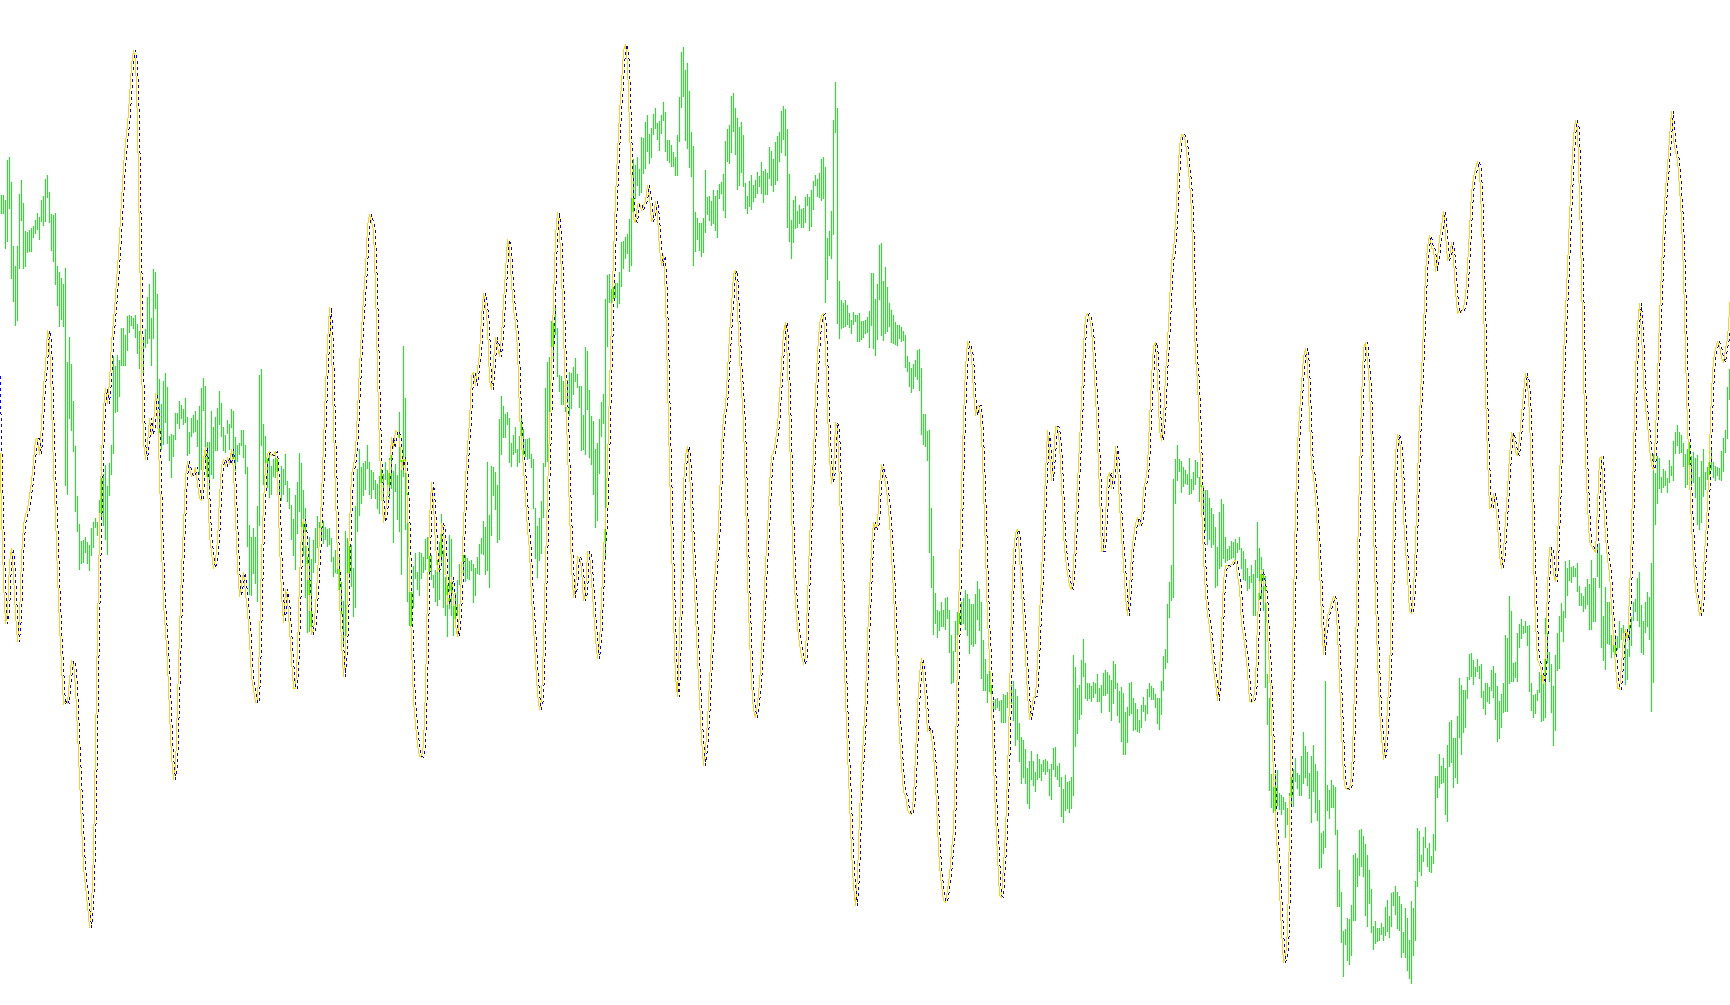
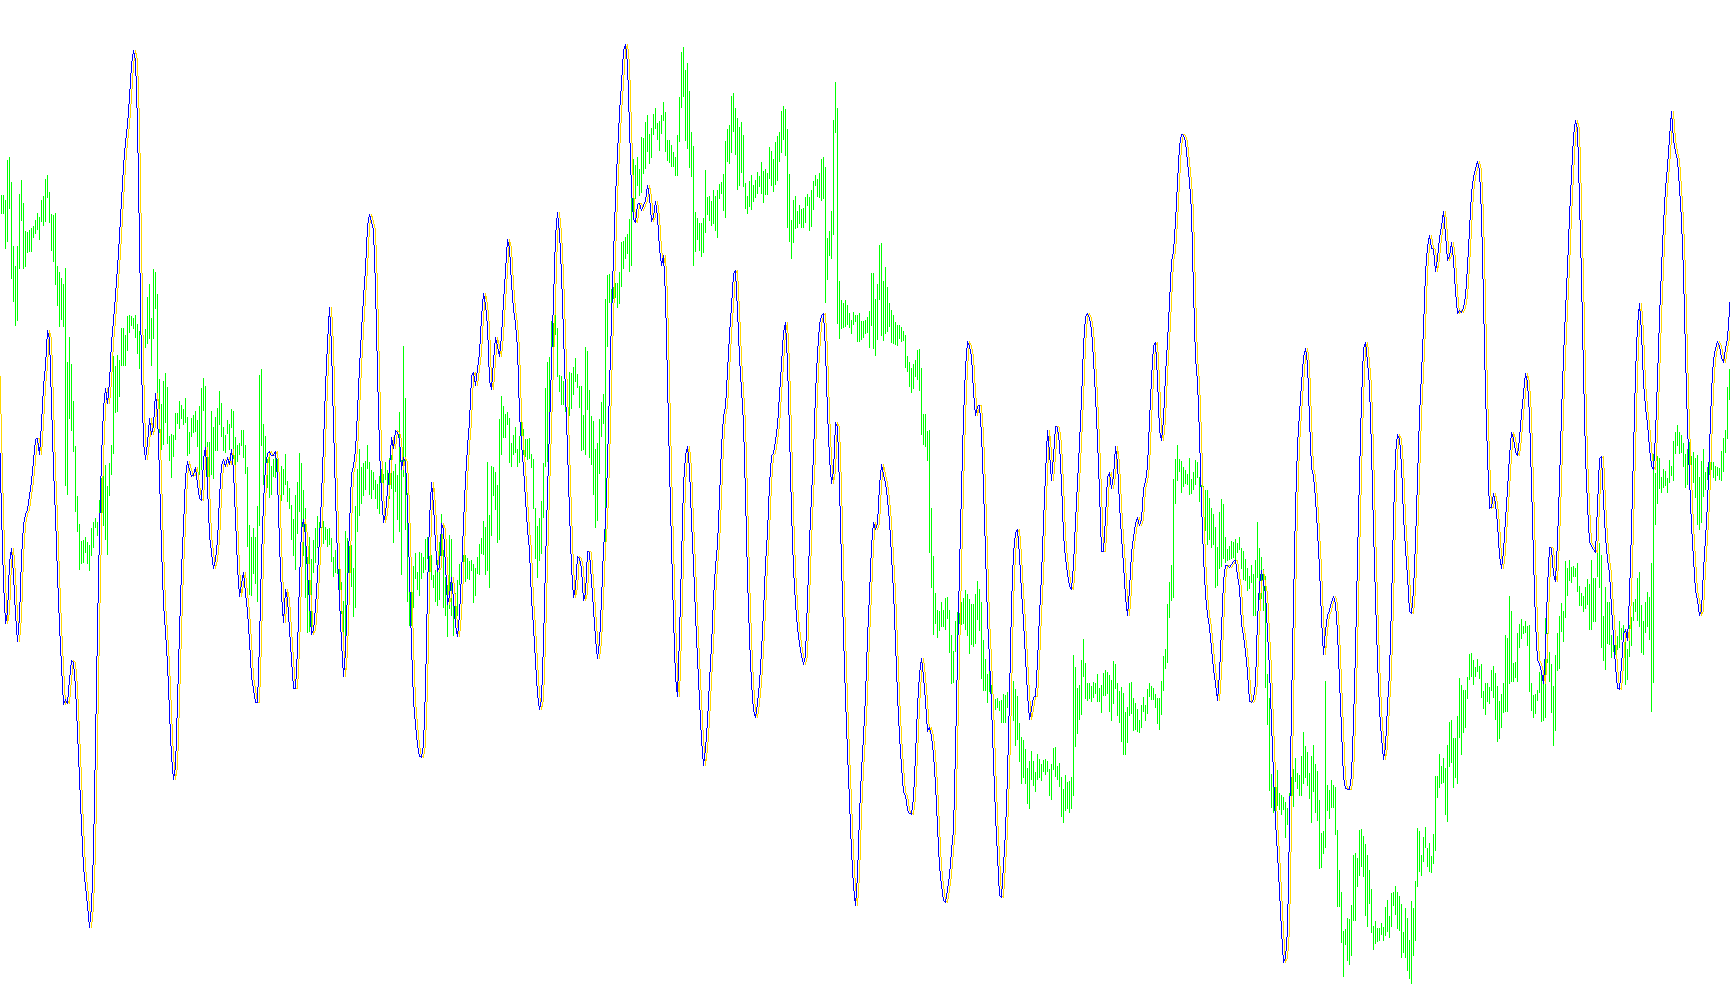
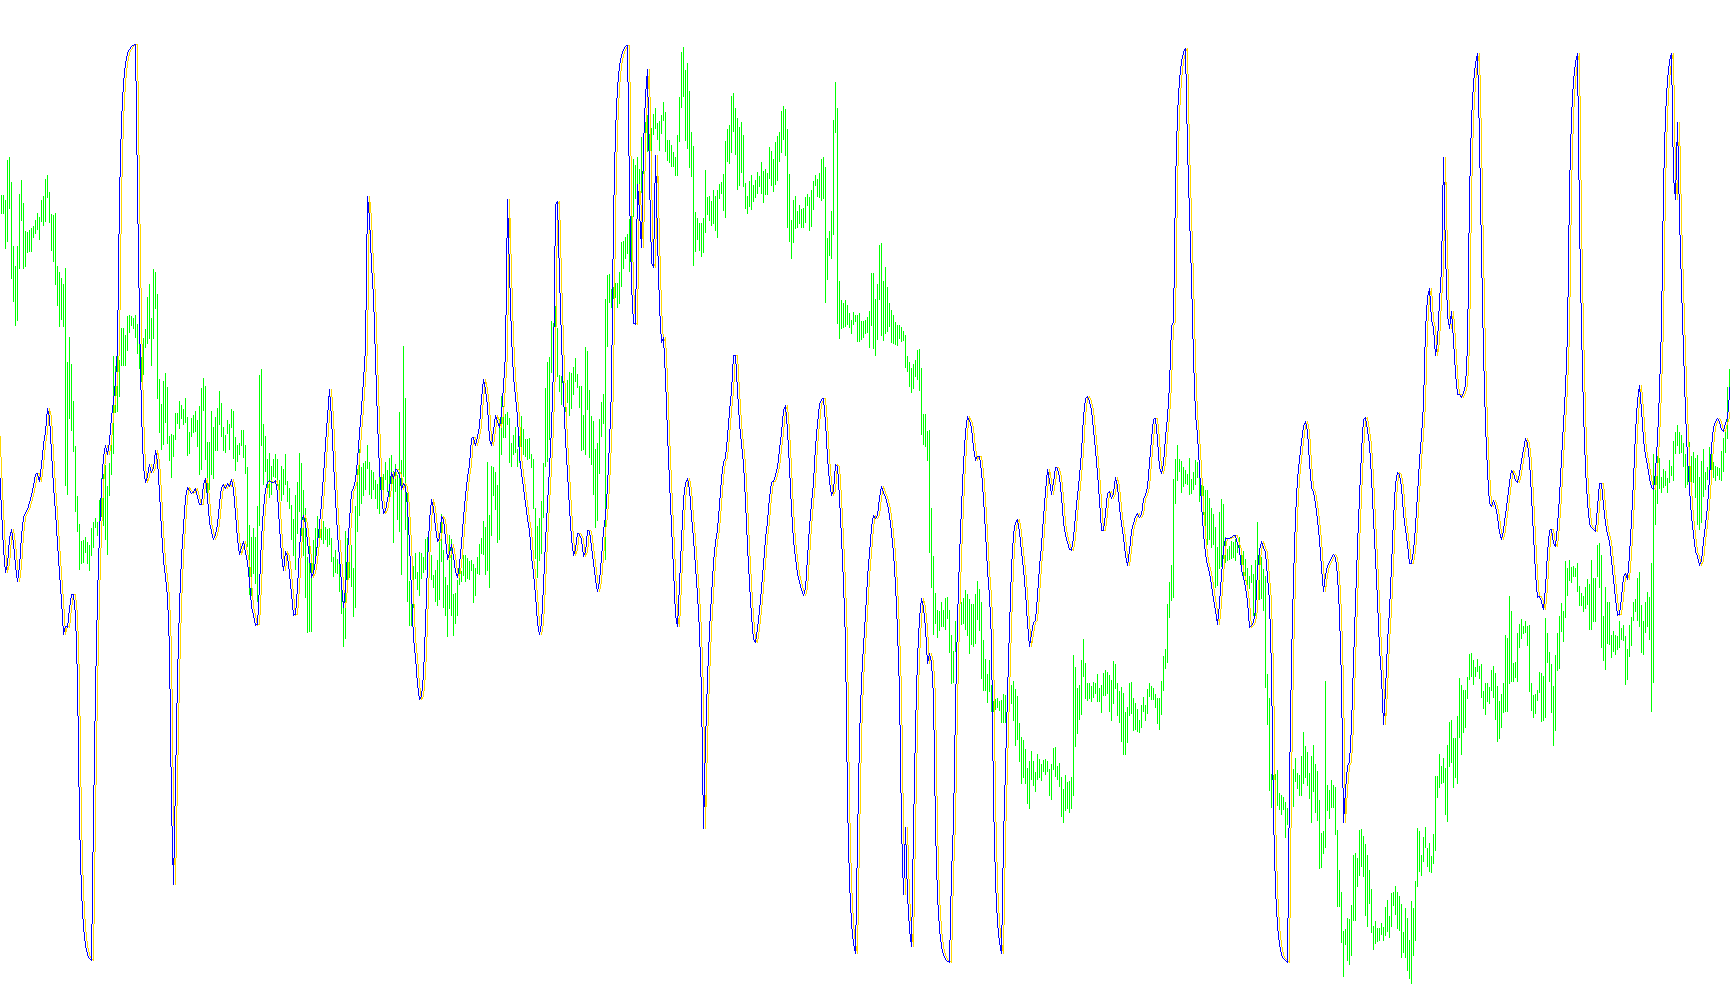
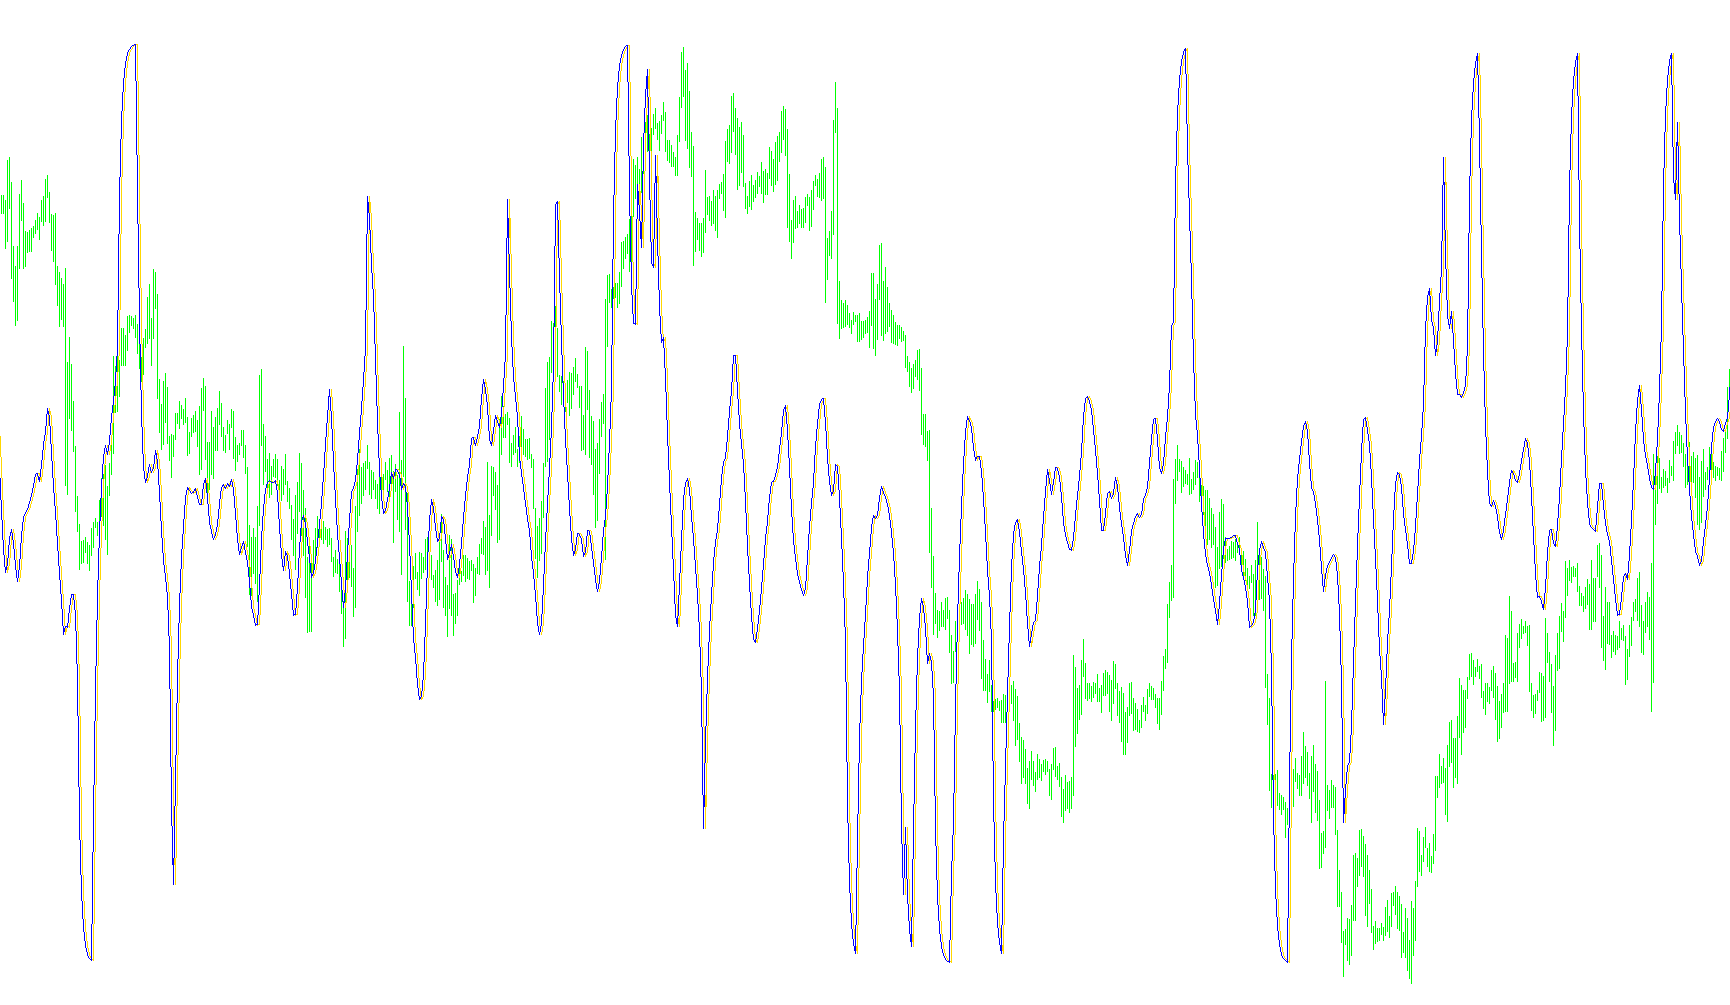
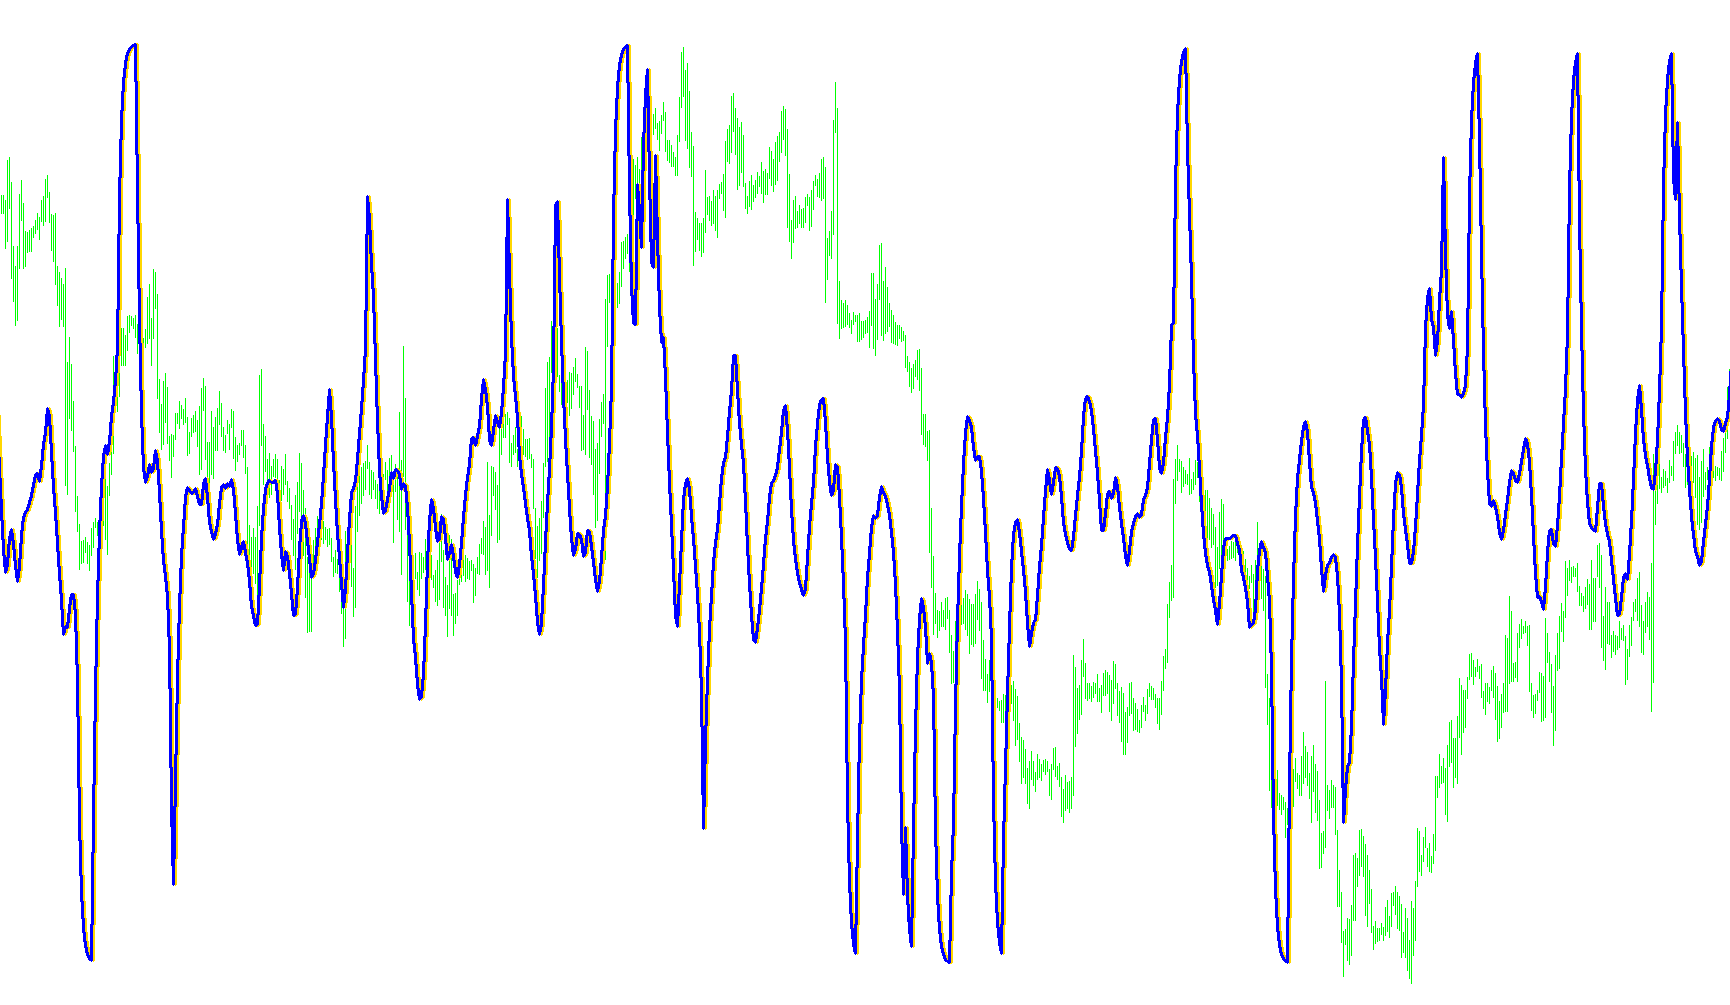
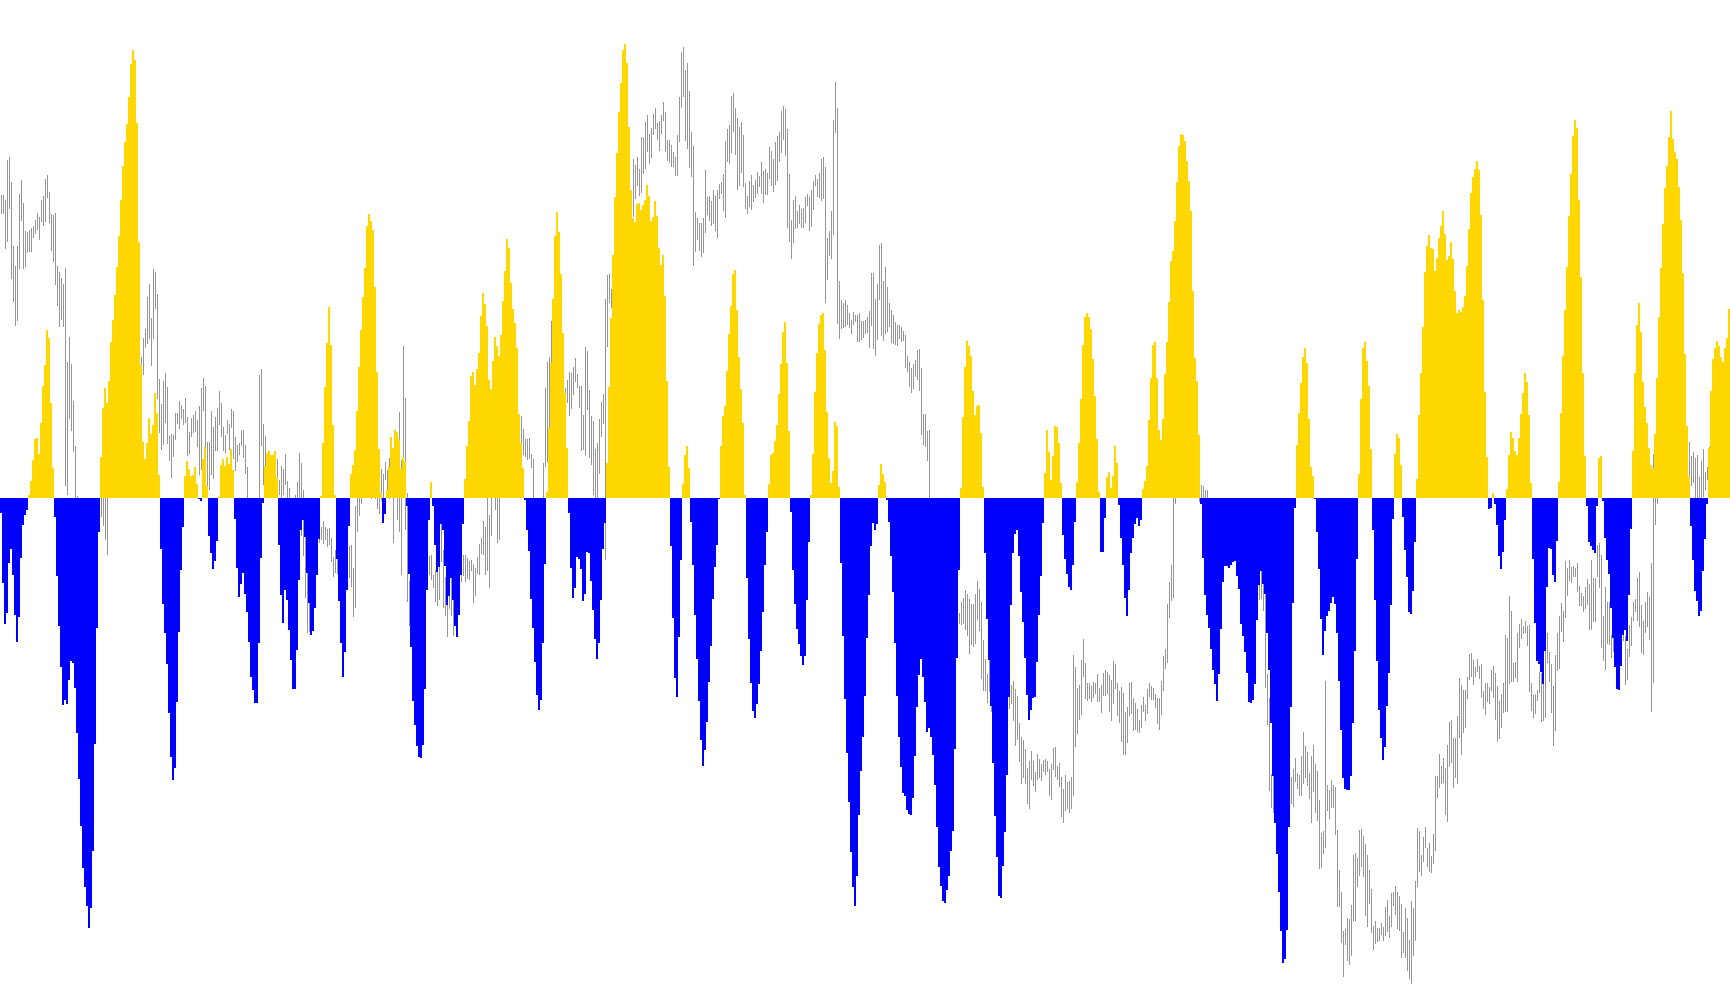
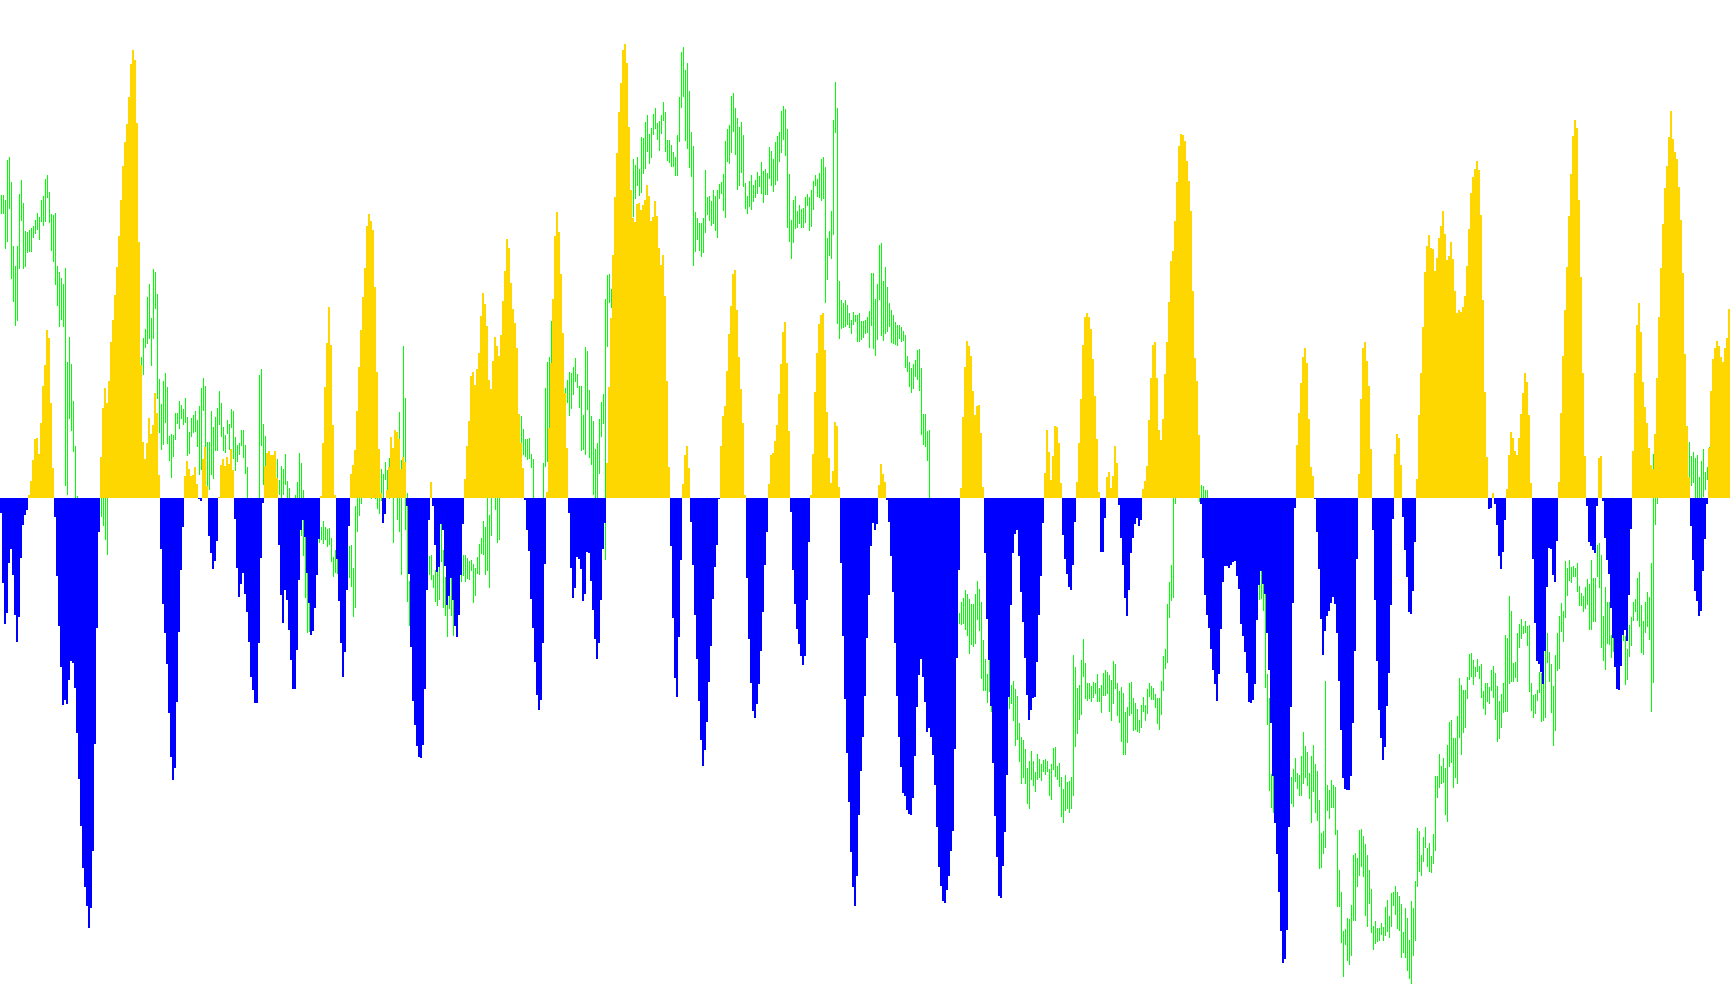
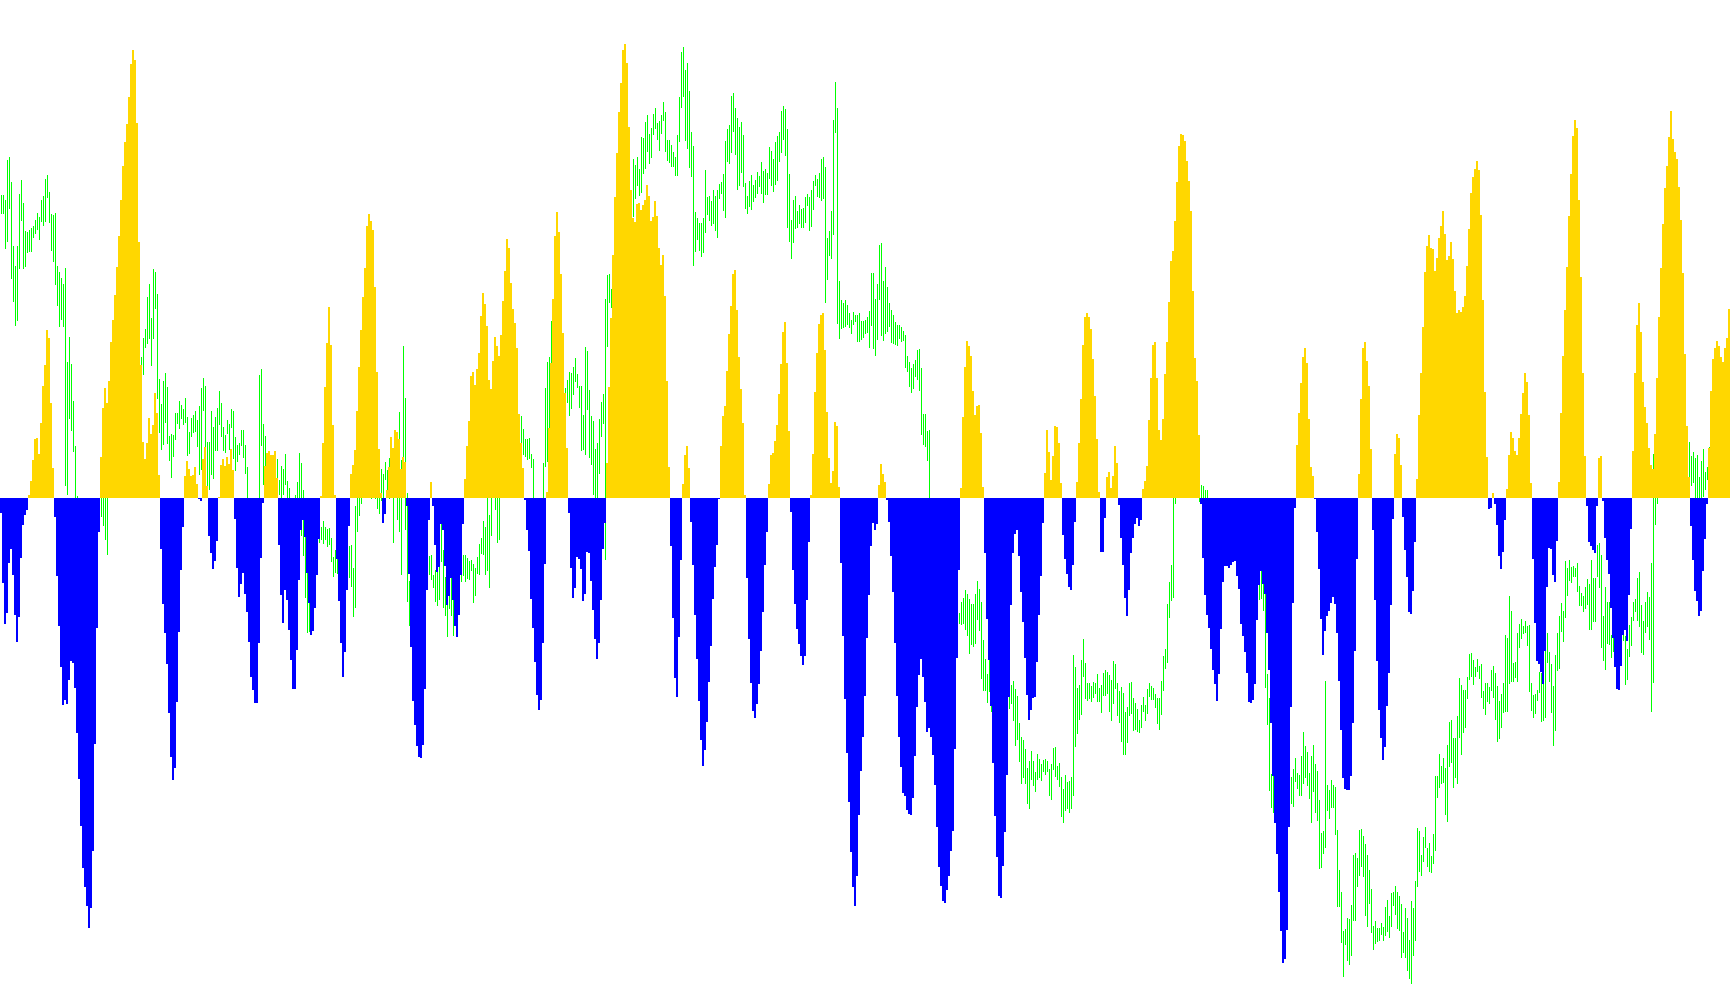
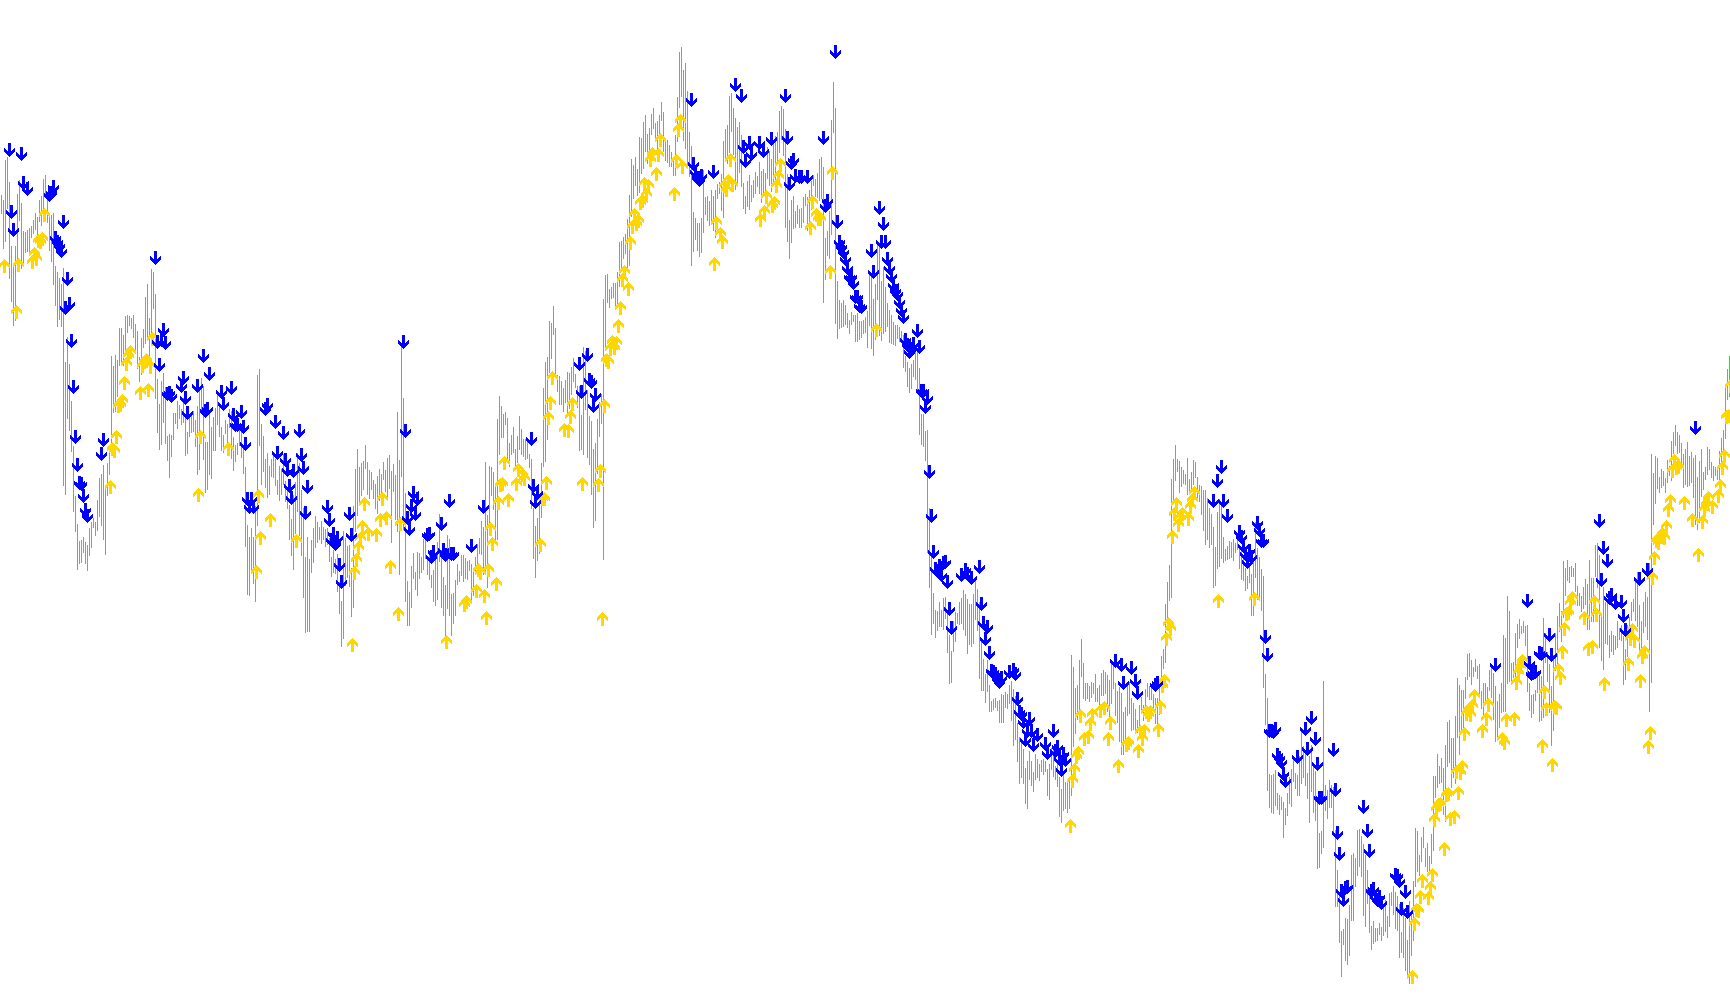
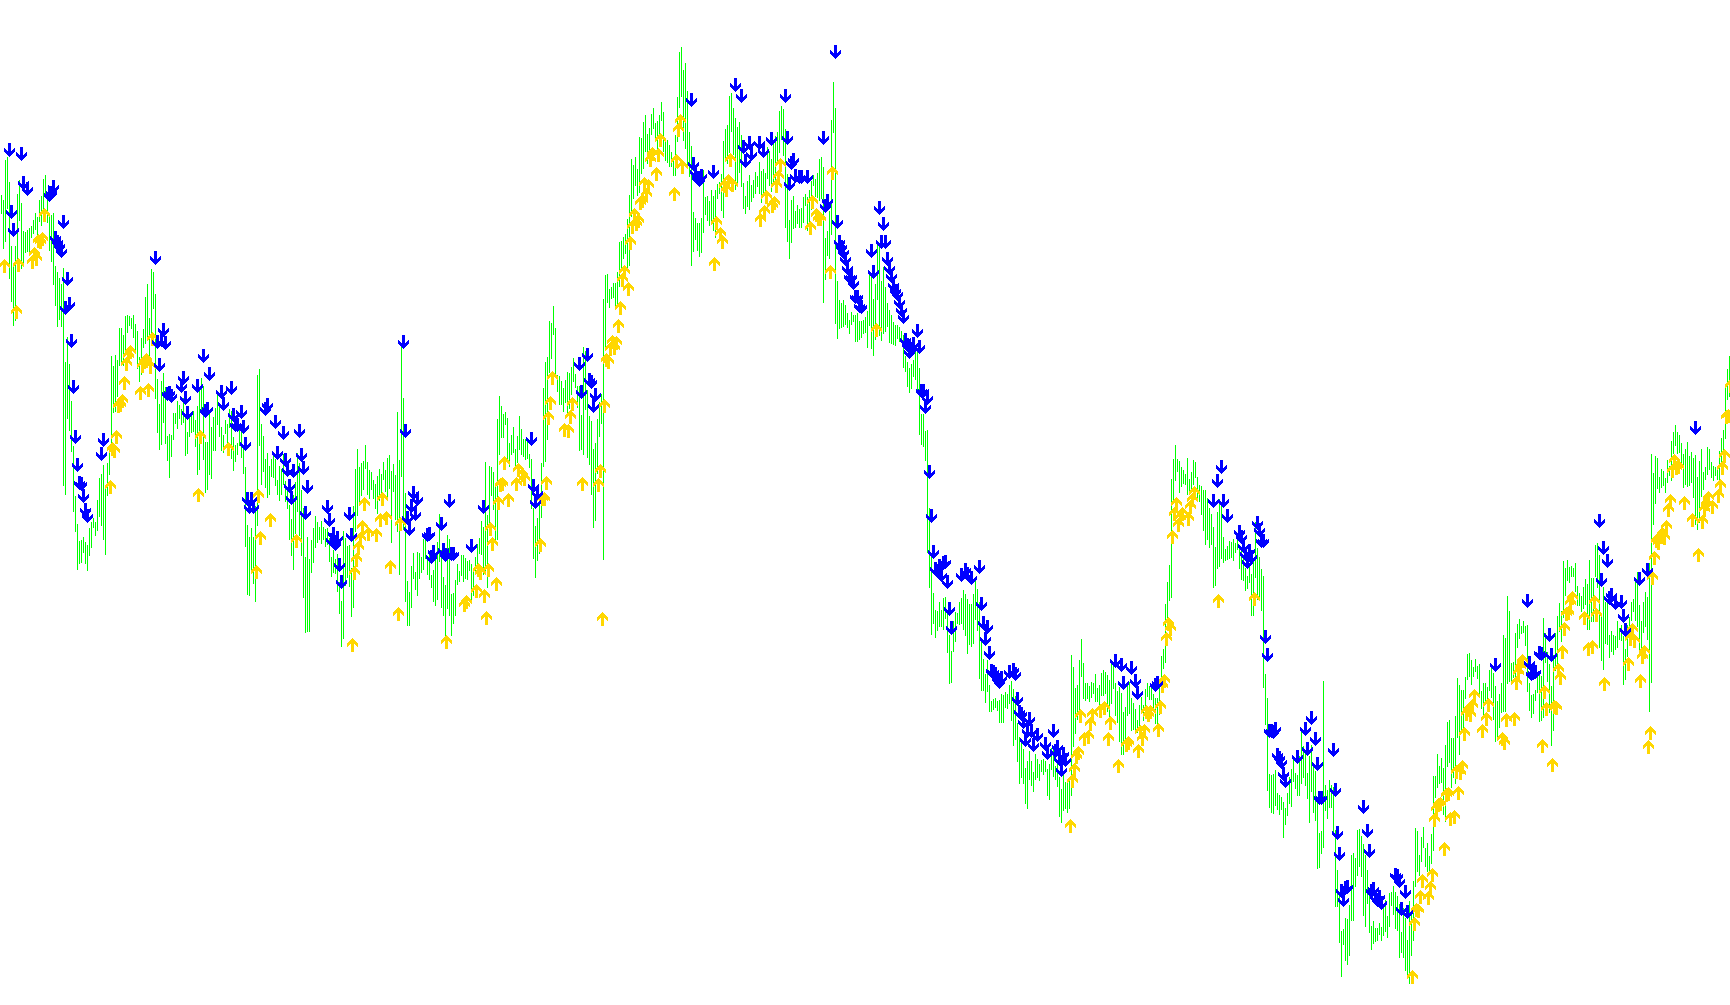
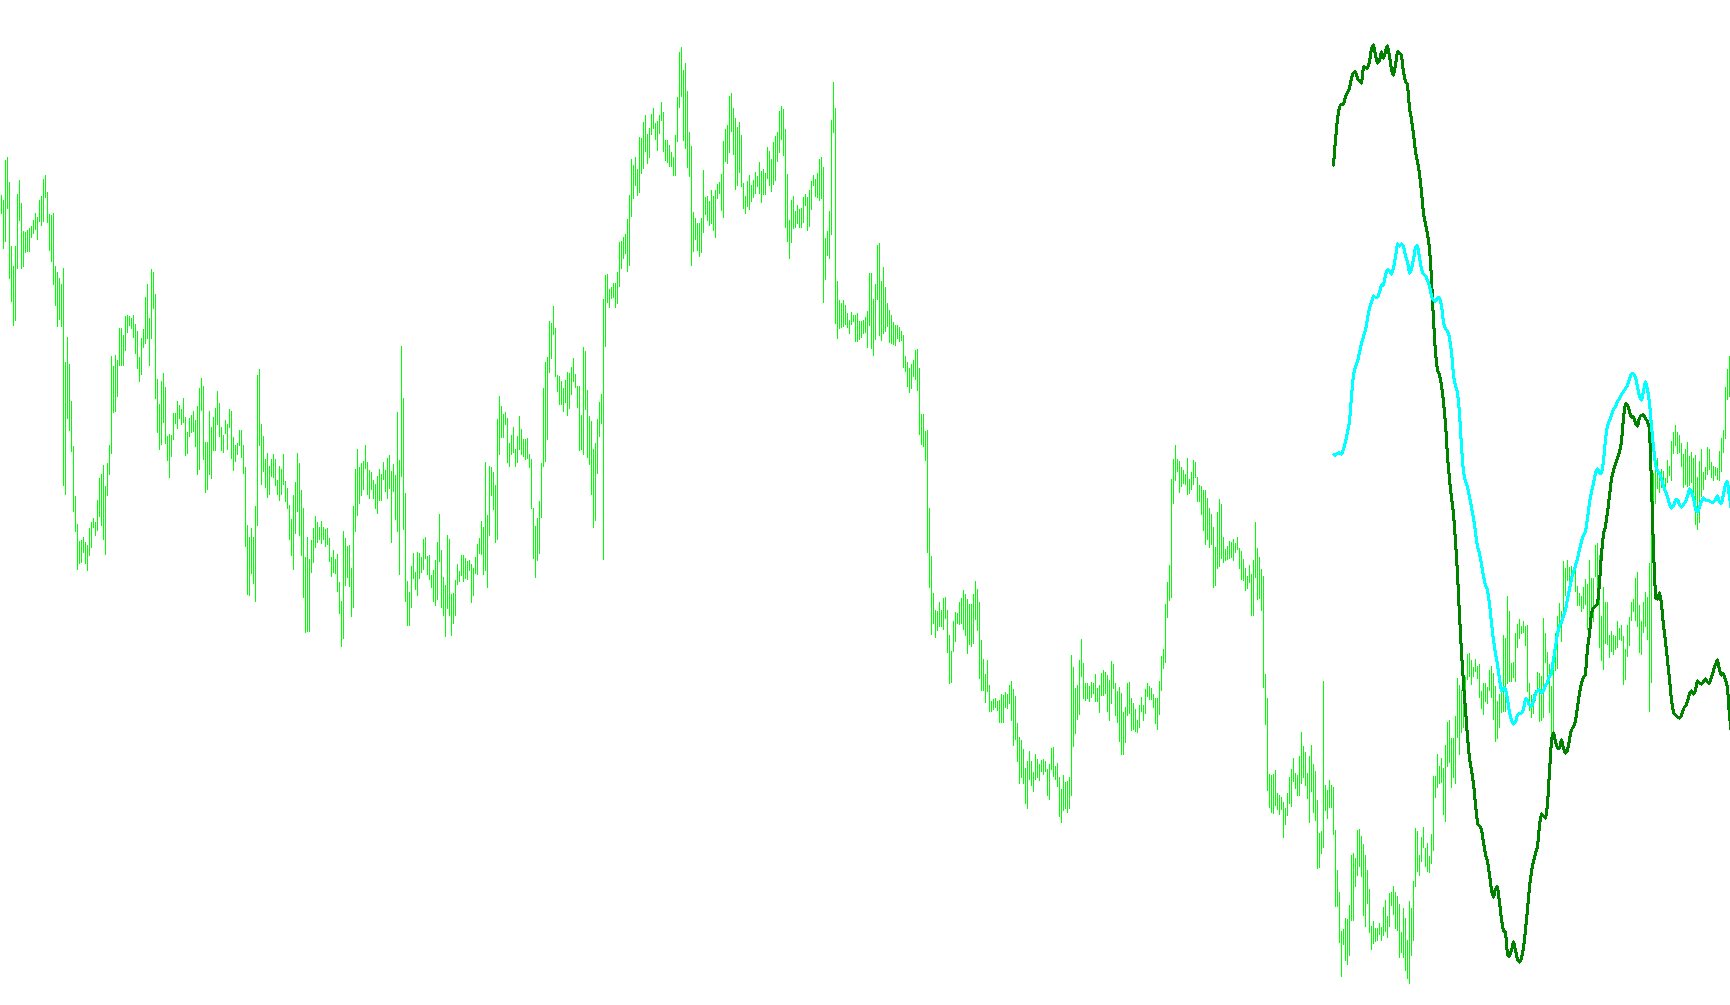
This indicator identifies trend direction and volatility zones by calculating dynamic Fibonacci-spaced price boundaries relative to a 55 SMA Median, filtered by weekly EMA/SMA momentum differentials.

FF Tunnel Slope
Indicator

FF Tunnel Slope

iMA

Quantifies the instantaneous rate of change between consecutive simple moving average values to identify price trajectory shifts.

FF Tunnel v3-1
Indicator

FF Tunnel v3-1

iMA

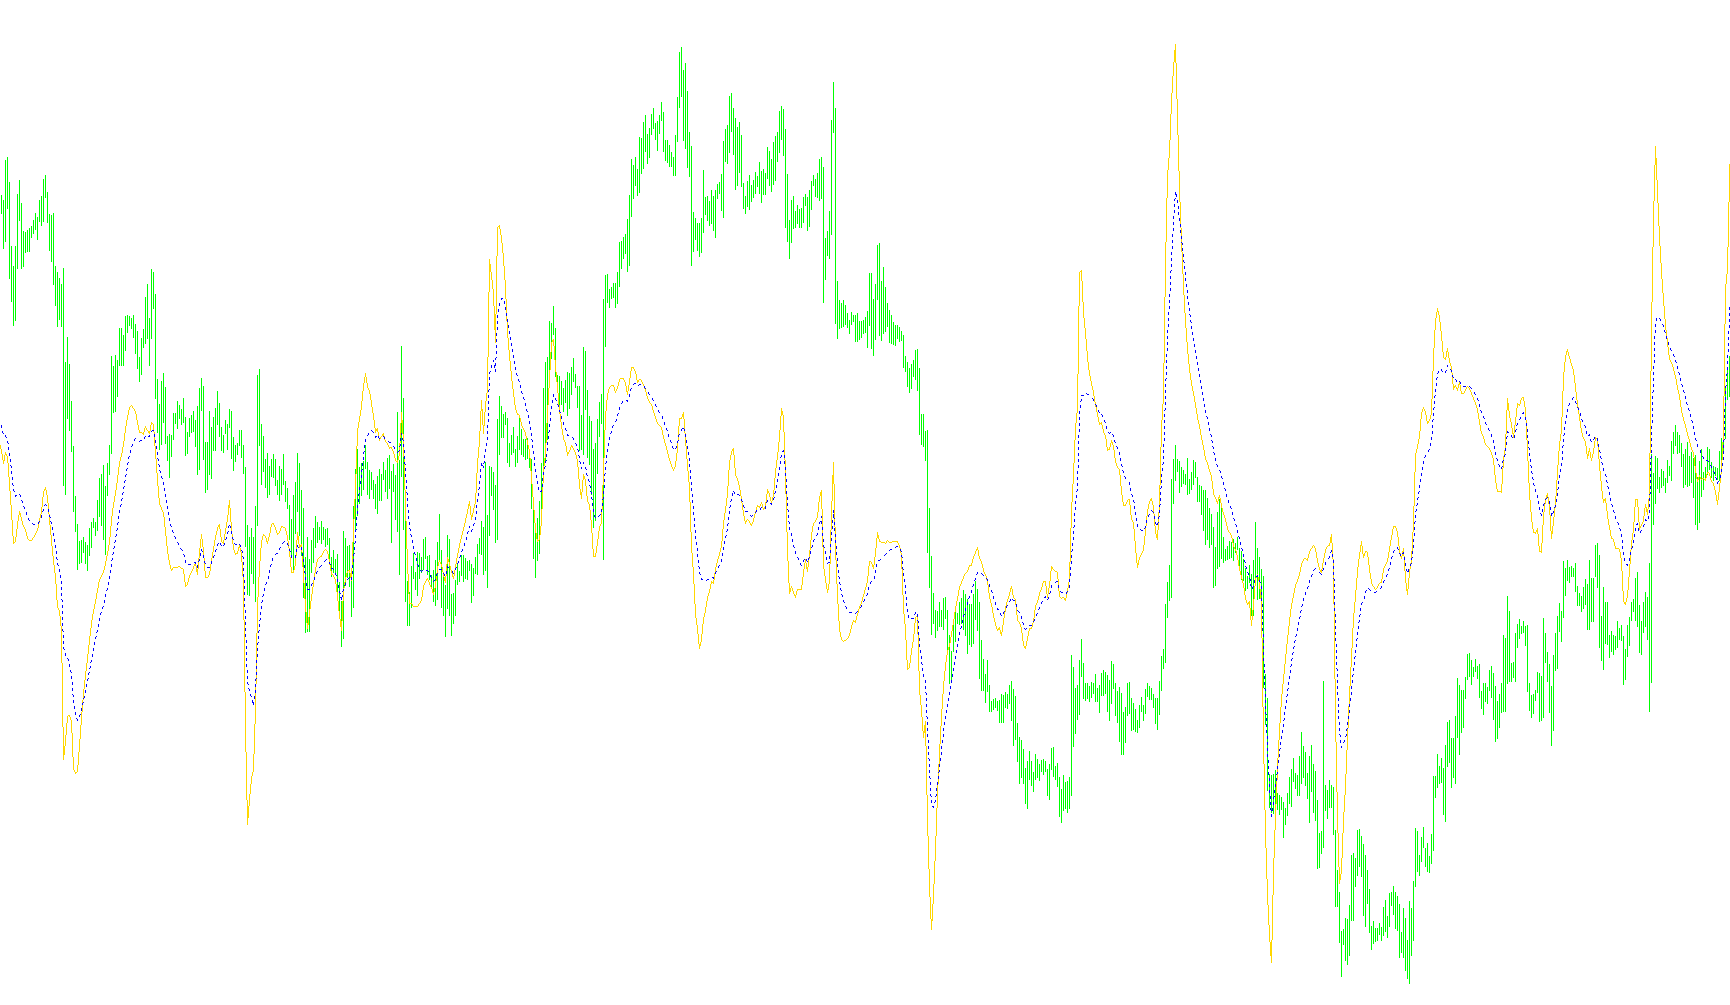
This indicator identifies high-probability trade zones by synthesizing macro-period directional bias with micro-period moving average convergence and Fibonacci-based risk offsets.

FF Tunnel v3
Indicator

FF Tunnel v3

iMA

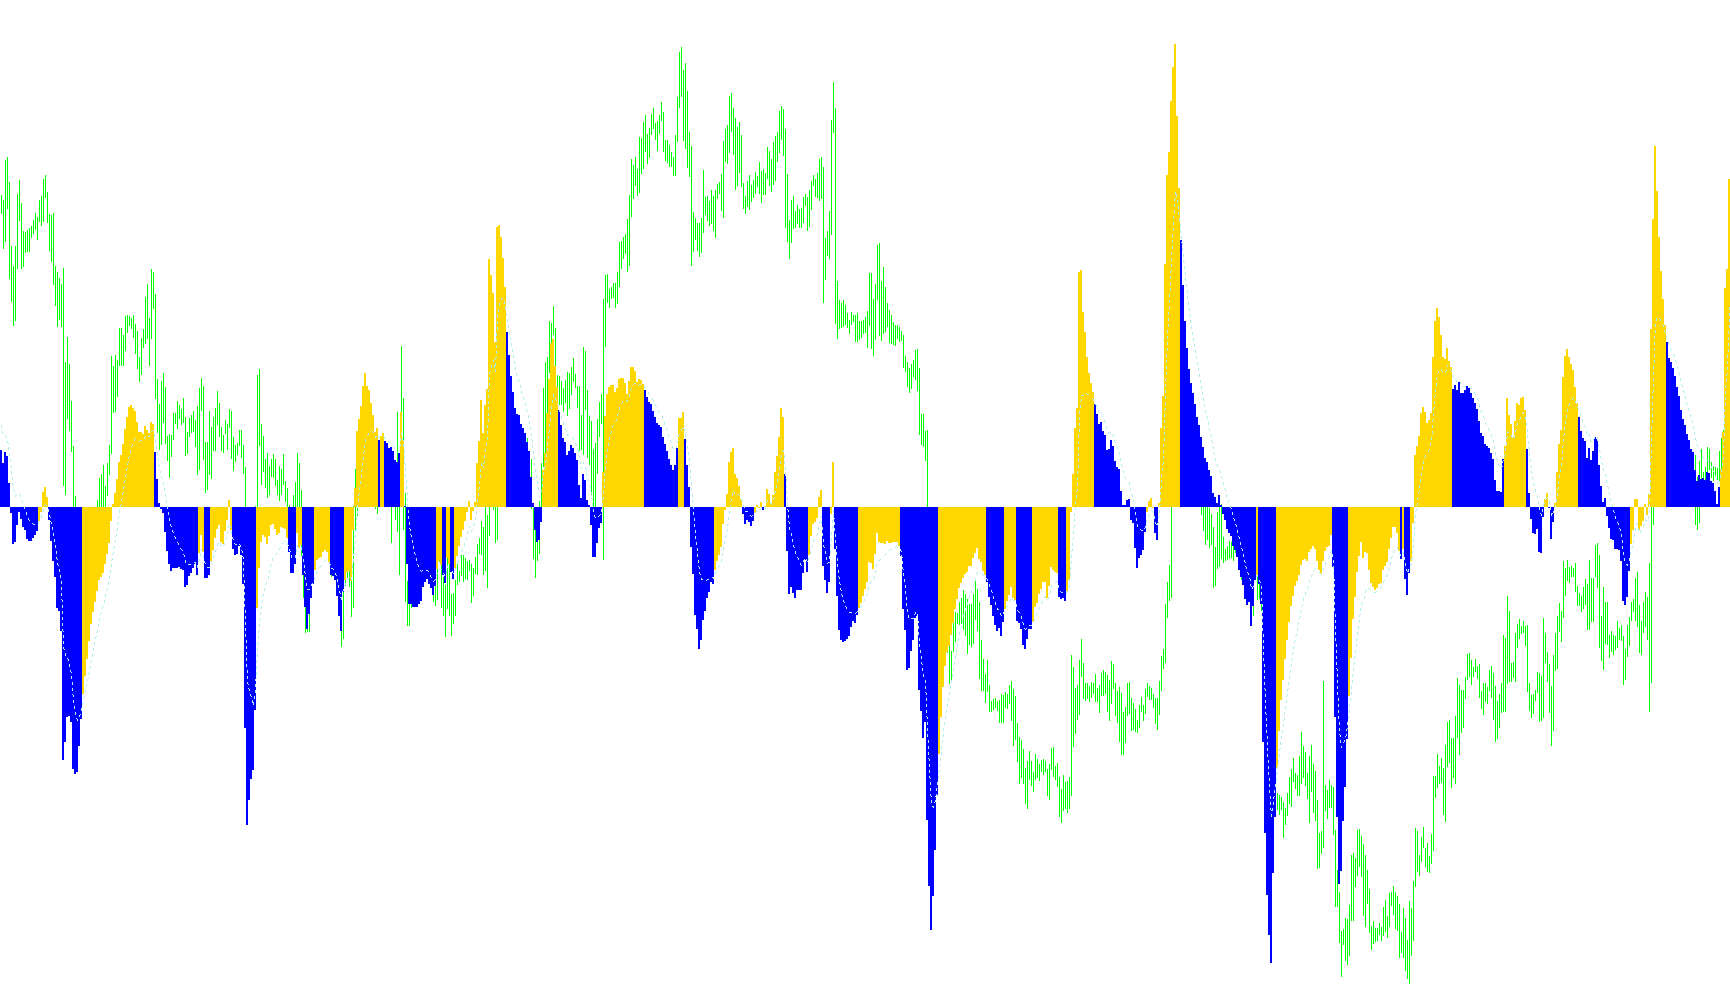
This indicator synchronizes macro weekly trend direction with micro hourly price action, utilizing dynamic Fibonacci displacement zones and slope-based neutrality filters to identify high-probability entry corridors.

Indicator

Fibonacci-based Moving Averages- Part 1

iMA
Fibonacci-based Moving Averages- Part 2
Indicator

Fibonacci-based Moving Averages- Part 2

iMA

This indicator plots a multi-layered ribbon of Exponential Moving Averages calculated using sequential Fibonacci numbers to identify long-term structural trend dynamics.

fibopivotcandlebar
Indicator

fibopivotcandlebar

iMACDiMAiMAOnArray

A multi-layered technical analysis tool that merges Fibonacci retracements, Pivot Point levels, ZigZag structure, and MACD trend momentum to generate high-probability directional signals.

FiboPivots
Indicator

FiboPivots

iMA

This tool dynamically projects a comprehensive hierarchy of Fibonacci retracements, pivot points, and exponential/simple moving averages onto the chart to identify high-probability price action zones.

FiboRetracementLevels
Indicator

FiboRetracementLevels

iMA

This indicator identifies key price reversal zones by dynamically projecting Fibonacci retracement levels based on high/low volatility extremes while simultaneously overlaying SMA and SMMA median trends.

fiboretracementlevels_v2
Indicator

fiboretracementlevels_v2

iMA

This indicator automates the projection of Fibonacci retracement levels based on recent high-low extremes while simultaneously overlaying moving average median lines to identify trend convergence.

FIBOstfTunnel
Indicator

FIBOstfTunnel

iMA

This indicator generates a dynamic price corridor by projecting static Fibonacci point offsets symmetrically around a 55-period Exponential Moving Average.

FIBTunnel
Indicator

FIBTunnel

iMA

This indicator projects a multi-layered price channel by calculating fixed point offsets based on the 55-period Exponential Moving Average to identify dynamic support and resistance zones.

Figurelli Series
Indicator

Figurelli Series

iMA

This indicator quantifies trend strength by calculating the net difference between price crossovers across a multi-layered sequence of Simple Moving Averages.

Filter_AO Alert
Indicator

Filter_AO Alert

iMA

This indicator visualizes trend direction by calculating the differential between two exponential moving averages and filtering momentum shifts through color-coded histogram changes.

Filter_AO
Indicator

Filter_AO

iMA

This indicator isolates specific directional momentum by visualizing the trend of an exponential moving average spread using a dual-histogram histogram technique.

Filter_AO_001
Indicator

Filter_AO_001

iMA

This indicator identifies directional momentum shifts by isolating histogram segments based on the relative growth or decay of a dual Exponential Moving Average spread.

Final Draft ArrZZx2_alerts
Indicator

Final Draft ArrZZx2_alerts

iMA

This indicator utilizes a multi-stage weighted price smoothing algorithm to identify structural pivot points and generate predictive trend reversal signals.

Indicator

Firebird HMA [i]

iMA
Indicator

Firebird_HMA_[i]

iMA
Indicator

Firestats v0.5

iMA
Indicator

Firestats2 v0.10

iMA
Fisher Transform
Indicator

Fisher Transform

iMA

This indicator transforms the Williams Percent Range into a logarithmic scale to visualize market momentum and trend reversals through Fisher-weighted smoothing.

Fisher Transform_v1
Indicator

Fisher Transform_v1

iMA

This indicator applies a logarithmic transformation to price action to identify extreme momentum shifts and potential trend exhaustion points.

Fisher_org_v1
Indicator

Fisher_org_v1

iMA

This indicator applies a logarithmic transformation to normalized price action to map unbounded price movements into a finite range for identifying momentum extremes.

Fisher_org_v12
Indicator

Fisher_org_v12

iMA

This indicator applies a Fisher Transform to the smoothed relative price position to linearize momentum extremes and identify trend reversals.

Fisher_org_v12_v1
Indicator

Fisher_org_v12_v1

iMA

This indicator applies a logarithmic transformation to the normalized price range and moving average spread to identify extreme momentum shifts and trend reversals.

Fisher_org_v12_v2
Indicator

Fisher_org_v12_v2

iMA

This indicator transforms price action into a non-linear momentum scale by applying a hyperbolic tangent transformation to normalized relative high-low ranges.

Fisher_org_v12_v3
Indicator

Fisher_org_v12_v3

iMA

This indicator utilizes a weighted price-to-range ratio transformed via hyperbolic tangent logic to identify overextended market momentum and potential trend exhaustion.

Fisher_v1
Indicator

Fisher_v1

iMA

This indicator utilizes a recursive smoothing algorithm and logarithmic transformation of price range positioning to identify momentum shifts and trend reversals.

Fisher_v1_001
Indicator

Fisher_v1_001

iMA

This indicator calculates a smoothed price position relative to a high-low range, transforming it into a logarithmic momentum scale to identify directional trend shifts.

Fisher_v1_002
Indicator

Fisher_v1_002

iMA

This indicator calculates a logarithmic momentum value by normalizing price action relative to historical extremes and applying a smoothed recursive weighting formula.

Five_MA_Crossover_Email_Alert
Indicator

Five_MA_Crossover_Email_Alert

iMA

This indicator identifies bullish or bearish momentum by detecting when the current price concurrently breaches five distinct moving average layers, including Linear Weighted and LSMA variants.

Five_MA_Crossover_Email_Alert_v1
Indicator

Five_MA_Crossover_Email_Alert_v1

iMA

This indicator identifies bullish or bearish momentum by detecting when price action simultaneously breaches five distinct moving average boundaries, providing real-time visual arrows and multi-channel notifications.

FixedChartScale
Indicator

FixedChartScale

iATRiMA

This indicator dynamically adjusts the fixed visual price boundaries of a trading chart by calculating margins based on price extremes and relative median averages.

FiyatKesisme
Indicator

FiyatKesisme

iMA

This indicator synthesizes relative price momentum across major currency pairs by calculating the variance between fast and slow moving averages for various base and quote currencies.

FlatTrend SMC modified
Indicator

FlatTrend SMC modified

iADXiMAiSAR

This indicator synthesizes multi-layer moving average stacking, Parabolic SAR price deviations, and ADX directional shifts to identify structural equilibrium and trend exhaustion.

FlatTrend SMC modified_v1
Indicator

FlatTrend SMC modified_v1

iADXiMAiSAR

This indicator identifies market equilibrium by synchronizing multi-period moving average alignment with Parabolic SAR reversals and ADX trend strength divergence.

FlatTrend_SMC_modified
Indicator

FlatTrend_SMC_modified

iADXiMAiSAR

The logic identifies bearish pressure via Parabolic SAR and ADX divergence while simultaneously validating bullish alignment through multi-period Moving Average stacking.

FlatTrend_SMC_modified_v1
Indicator

FlatTrend_SMC_modified_v1

iADXiMAiSAR

Identifies structural market dynamics by synthesizing moving average ordering, Parabolic SAR price crossovers, and ADX directional momentum.

Indicator

FN Diver Osc

iMAiMAOnArrayiStdDev
FN Signal
Indicator

FN Signal

iMAiMAOnArrayiStdDev

This indicator quantifies price velocity by applying a logarithmic transformation to standardized deviation residuals, then utilizes dual EMA crossovers on the resulting signal to identify trend reversals.

FN Signal_v2
Indicator

FN Signal_v2

iMAiMAOnArrayiStdDev

This indicator transforms price action into a momentum signal by calculating the log-ratio of normalized price deviations relative to moving averages.

FNCD
Indicator

FNCD

iMAiMAOnArrayiStdDev

The indicator calculates a normalized price deviation from the moving average using standard deviation, transforms it via a logarithmic Fisher function to accentuate momentum extremes, and applies dual exponential moving averages for trend smoothing.

FN_Signal
Indicator

FN_Signal

iMAiMAOnArrayiStdDev

This indicator calculates a normalized price deviation from the mean, applies a logarithmic transformation to dampen extremes, and utilizes dual EMA crossovers for trend momentum detection.

Force Index
Indicator

Force Index

iMA

This indicator quantifies market aggression by multiplying the current volume by the rate of change in moving average price deviations.

Force Index_v1M2LA_mtf
Indicator

Force Index_v1M2LA_mtf

iMA

This indicator quantifies market pressure by calculating the product of trading volume and moving average price differentials across multiple timeframes to identify significant momentum breakouts.

Force Index_v1M2L_mtf
Indicator

Force Index_v1M2L_mtf

iMA

This indicator quantifies price velocity by calculating the product of volume and moving average differences across selectable higher timeframes to detect momentum shifts.

Force_Index
Indicator

Force_Index

iMA

This indicator quantifies market aggression by calculating the product of current trading volume and the rate of change in moving average price variance.

Indicator

Forex Freeway

iCCIiMA
Indicator

Forex Freeway_2-RSX

iMA