Indicator

Optimisator for Combined MA Signal

iMA
OrderGuardian
Indicator

OrderGuardian

iMAiSAR

This EA automates trade management by identifying dynamic profit targets and stop-loss levels based on trendlines, channels, and technical indicators like SAR or Envelopes.

Indicator

OSC-MTF_CF_SYSv1.1

iMA
osc1
Indicator

osc1

iMA

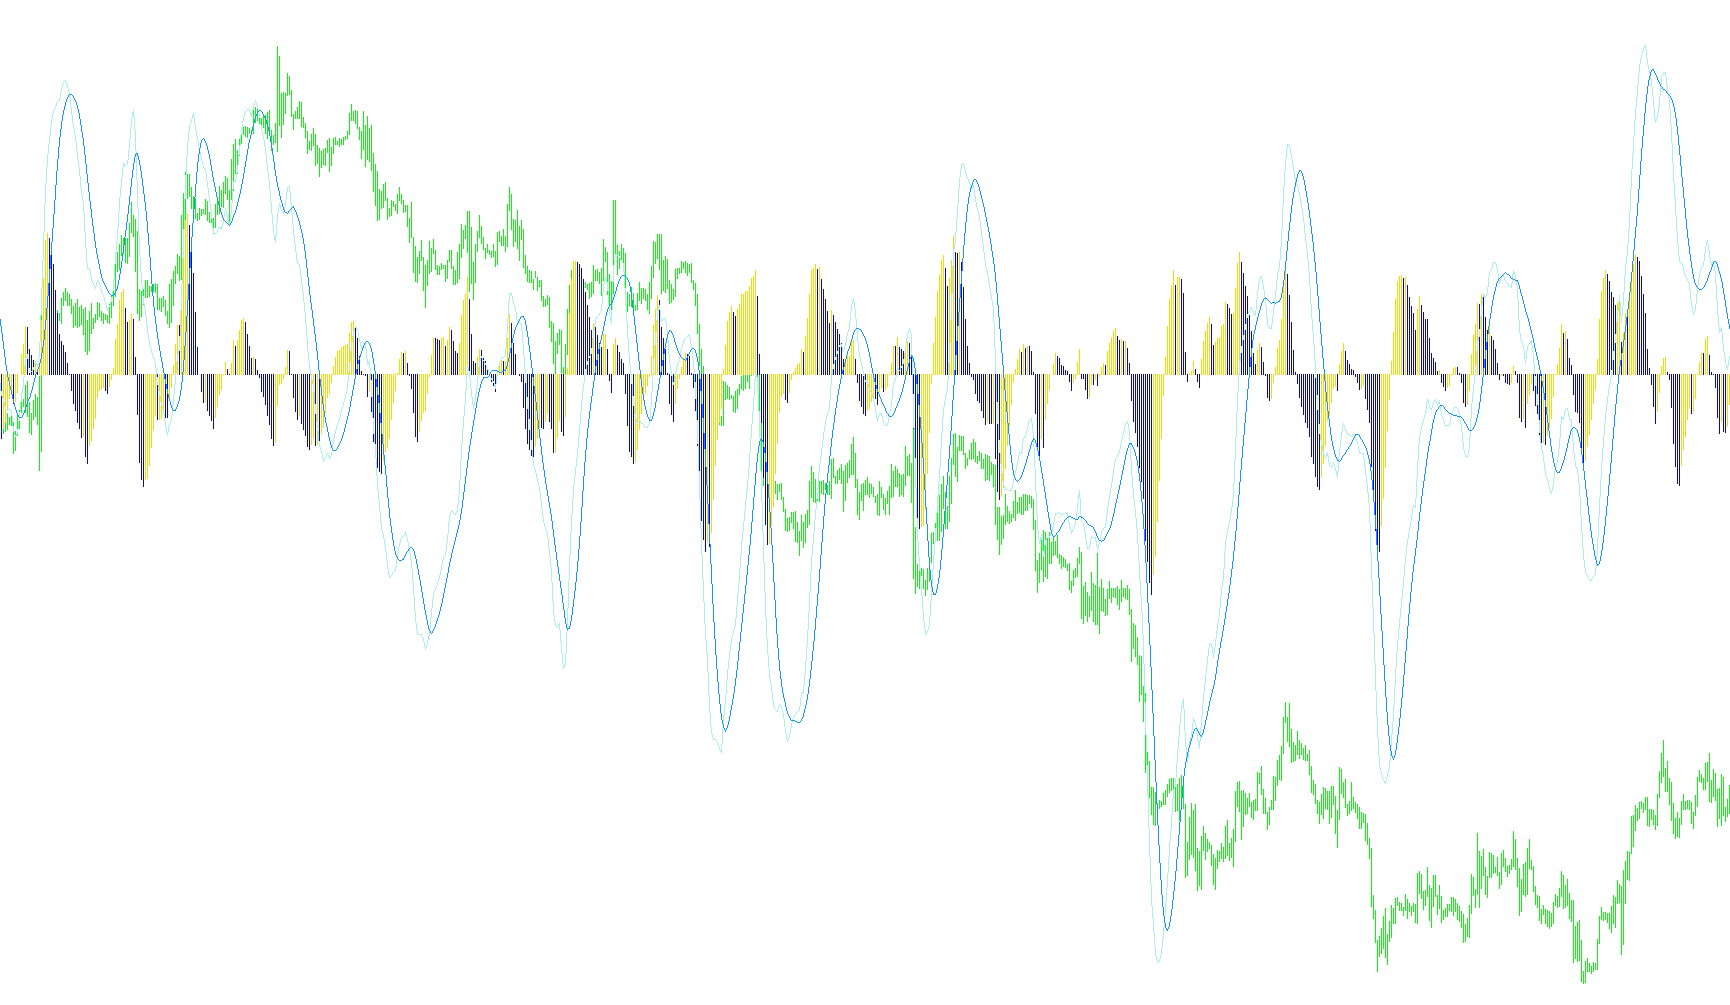
This indicator calculates a smoothed momentum value by applying a multi-stage triple exponential smoothing filter to price action to identify underlying trend trajectories.

oscillatorsonchart
Indicator

oscillatorsonchart

iCCIiMAiRSI

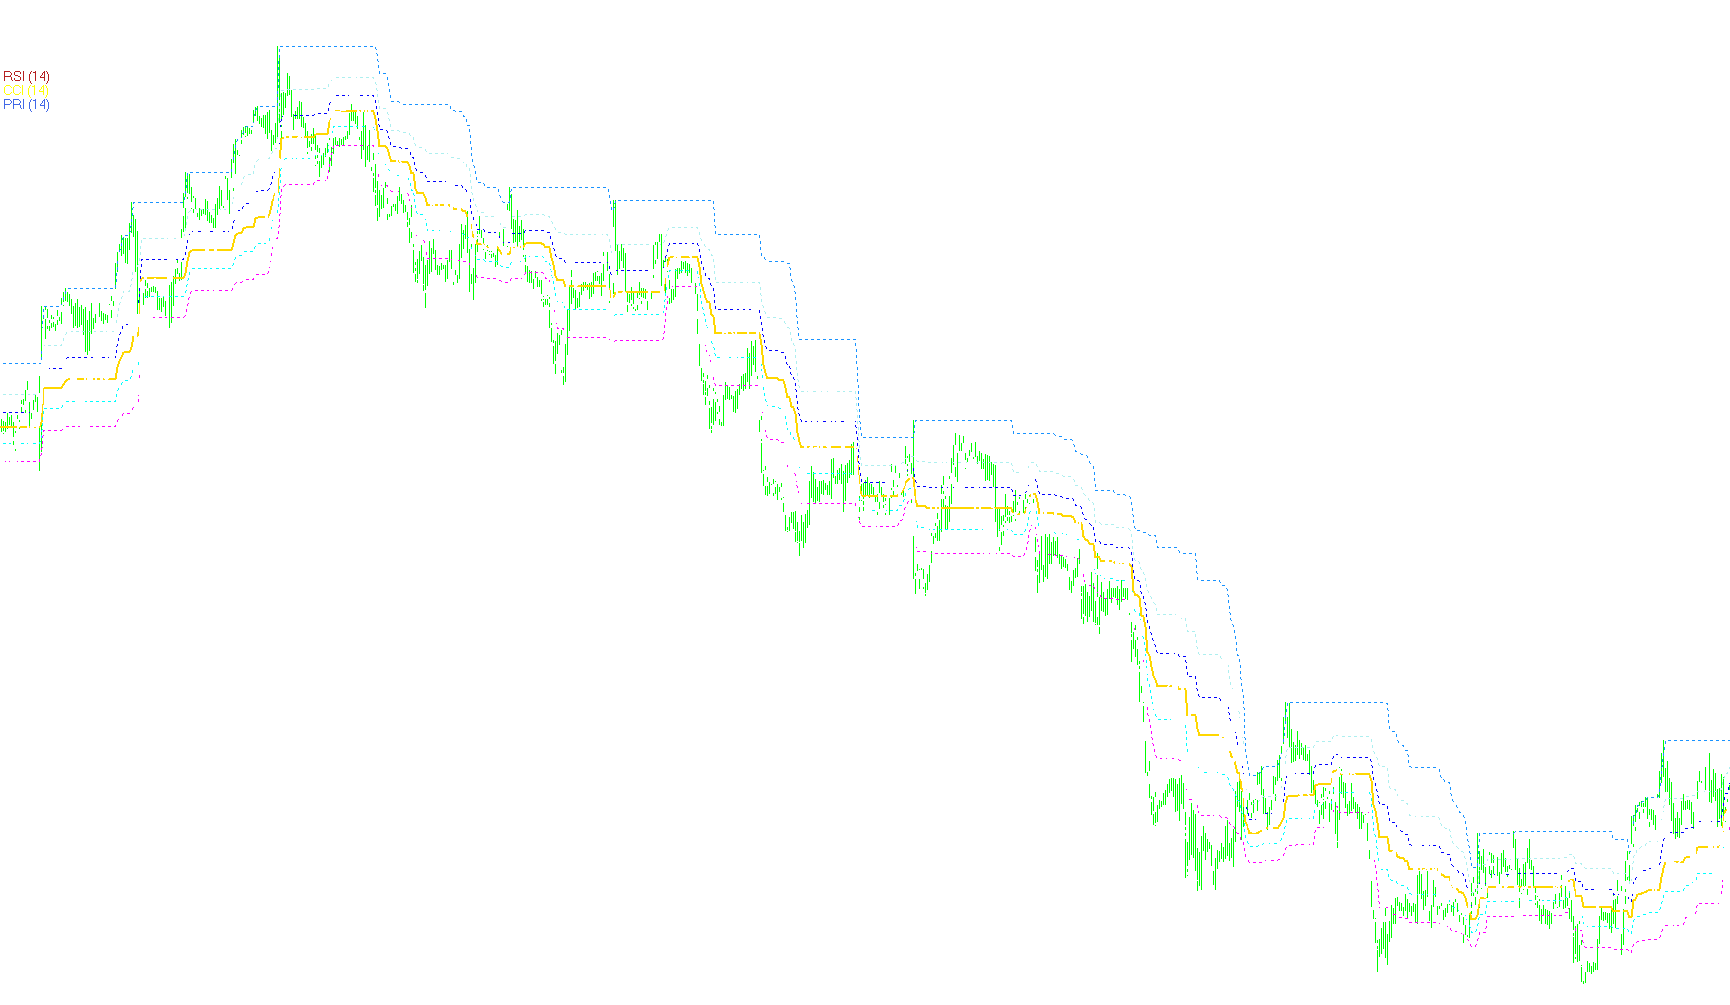
This indicator maps normalized RSI, CCI, and PRI values onto the price chart using dynamic median and range calculations to identify momentum breaches.

oscillator_of_indicator_and_ma
Indicator

oscillator_of_indicator_and_ma

iCCIiMACDiRVIiRSI

This tool synthesizes primary data from various technical oscillators—including MACD, RSI, CCI, RVI, and DeMarker—to calculate a unified momentum difference between the main indicator and its signal line.

OsHMA
Indicator

OsHMA

iMAiMAOnArray

This indicator calculates the difference between two Hull Moving Averages of varying periods to identify trend momentum and price velocity.

OsMA  THV
Indicator

OsMA THV

iMAiMAOnArray

This indicator calculates the difference between the MACD line and its signal line to visualize momentum shifts via a color-coded histogram and zero-line crossover alerts.

OsMA
Indicator

OsMA

iMAiMAOnArray

Calculates the instantaneous variance between a dual-EMA spread and its moving average signal to visualize price momentum shifts.

OsMAII
Indicator

OsMAII

iMAiMAOnArray

Calculates a derivative of the MACD by subtracting its smoothed signal line from the raw difference of dual exponential moving averages.

OsMA_ColorHist_Alert
Indicator

OsMA_ColorHist_Alert

iMAiMAOnArray

This indicator computes a moving average of the MACD values to generate an oscillating histogram that identifies momentum shifts and zero-line crossovers.

OsMA_ColorHist_AlertNew
Indicator

OsMA_ColorHist_AlertNew

iMAiMAOnArray

This indicator calculates the difference between an exponential moving average and a signal line to visualize momentum shifts through a dual-colored histogram that triggers alerts on zero-line transitions.

OsMA_In_Color
Indicator

OsMA_In_Color

iMAiMAOnArray

This visual tool bifurcates the Moving Average of Oscillator (MACD) into a dual-colored histogram based on positive and negative deviations from the signal line.

OsMA_v1
Indicator

OsMA_v1

iMAiMAOnArray

This indicator calculates the difference between a smoothed MACD line and its signal average to isolate underlying price momentum.

OsMA_v2
Indicator

OsMA_v2

iMAiMAOnArray

This indicator computes a histogram by subtracting a Signal SMA from the difference between two Exponential Moving Averages.

OsUSD
Indicator

OsUSD

iMA

This indicator calculates a synthetic currency strength index by aggregating the weighted price differentials of EURUSD, GBPUSD, USDCHF, and USDJPY to identify directional USD dominance.

OzFX Daily Signals v1
Indicator

OzFX Daily Signals v1

iACiMAiStochastic

This indicator identifies trend reversals by correlating the direction of the Accumulation/Distribution (AC) index with Stochastic oscillator thresholds while overlaying a 200-period Simple Moving Average for structural bias.

OzFx Signals v1.2
Indicator

OzFx Signals v1.2

iACiATRiMAiStochastic

This indicator scans a custom list of currency pairs to identify high-probability long and short entries by synchronizing Awesome Oscillator momentum shifts, Stochastic oscillator crossovers, and SMA trend filtering.

OzFx Signals v1.7
Indicator

OzFx Signals v1.7

iACiAOiATRiStochastic

A multi-currency dashboard that concurrently processes Awesome Oscillator, Stochastic, and ATR metrics across multiple timeframes to identify synchronized momentum shifts and volatility breakouts.

OzFx Signals v1.7_v1
Indicator

OzFx Signals v1.7_v1

iACiAOiATRiStochastic

This multi-currency dashboard identifies bullish and bearish opportunities by synchronizing Awesome Oscillator reversals, Stochastic momentum thresholds, and SMA trend filters across multiple pairs simultaneously.

OzFX smD1 iSignals v4
Indicator

OzFX smD1 iSignals v4

iACiATRiMAiStochastic

This indicator synthesizes momentum from the Awesome Oscillator, Stochastic oscillators, and moving averages to trigger three distinct entry methodologies: standard trend confirmation, AES volatility logic, and swing point detection.

OzFX_D1_IndAES_v1.0
Indicator

OzFX_D1_IndAES_v1.0

iACiAOiMAiStochastic

This indicator identifies trend reversals by correlating Awesome Oscillator (AO) momentum shifts with Stochastic crossovers, complemented by optional SMA and RSI trend filtration.

OzFX_D1_IndAES_v1.0_v1
Indicator

OzFX_D1_IndAES_v1.0_v1

iACiAOiMAiStochastic

This indicator identifies bullish and bearish market shifts by correlating smoothed acceleration changes with stochastic momentum thresholds while providing optional moving average and RSI trend filtration.

PairDifference
Indicator

PairDifference

iMA

This indicator calculates the percentage deviation of multiple currency pairs from their respective moving average benchmarks to visualize relative price momentum across different markets simultaneously.

Paires V_5
Indicator

Paires V_5

iBandsiMAiSAR

This indicator synchronizes Parabolic SAR, Bollinger Bands, and triple EMA smoothing with real-time price action visualization to identify trend momentum and volatility boundaries.

pairsindex
Indicator

pairsindex

iCCIiATRiMAiMAOnArray
Indicator

PDI

iMA
Indicator

PDI_001

iMA
Pearson2
Indicator

Pearson2

iMAiStdDev

This indicator quantifies the linear relationship between two separate currency pairs by calculating the Pearson correlation coefficient based on moving average deviations and standard deviations.

PEMA
Indicator

PEMA

iMAiMAOnArray

This indicator computes a high-order smoothed signal by applying recursive exponential moving averages and weighting them through a polynomial coefficient expansion.

PhilNelSignals
Indicator

PhilNelSignals

iMA

This indicator identifies trend reversals by detecting specific price action entrapments between three distinct moving averages combined with a steep angular slope threshold.

Phoenix5_Ind_1
Indicator

Phoenix5_Ind_1

iEnvelopesiOsMAiMA
Phoenix5_Ind_1_v1
Indicator

Phoenix5_Ind_1_v1

iEnvelopesiOsMAiMA
Phoenix5_Ind_1_v2
Indicator

Phoenix5_Ind_1_v2

iEnvelopesiOsMAiMA
pivot detector osillator
Indicator

pivot detector osillator

iMAiRSI

The indicator normalizes the Relative Strength Index based on dual threshold boundaries that shift dynamically depending on whether price is above or below its long-term moving average.

Planet
Indicator

Planet

iMACDiMAiRSIiStochastic

This indicator identifies high-probability trend shifts by synchronizing H4 momentum filters—specifically EMA crossovers, RSI levels, and Stochastic trends—with real-time price action triggers.

Indicator

PlotGraph

iMA
PowerTrend
Indicator

PowerTrend

iMA

This indicator calculates directional momentum by extracting and comparing specific weighted price offsets from a cumulative moving average summation.

PPO
Indicator

PPO

iMAiMAOnArray

This indicator quantifies price velocity by calculating the percentage difference between two exponential moving averages relative to the slower trend line.

PPO_v2
Indicator

PPO_v2

iMAiMAOnArray

This indicator quantifies price velocity by calculating the percentage difference between two exponential moving averages relative to their slower component.
Pretty_t3_LK_V1.2
Indicator

Pretty_t3_LK_V1.2

iATRiMA

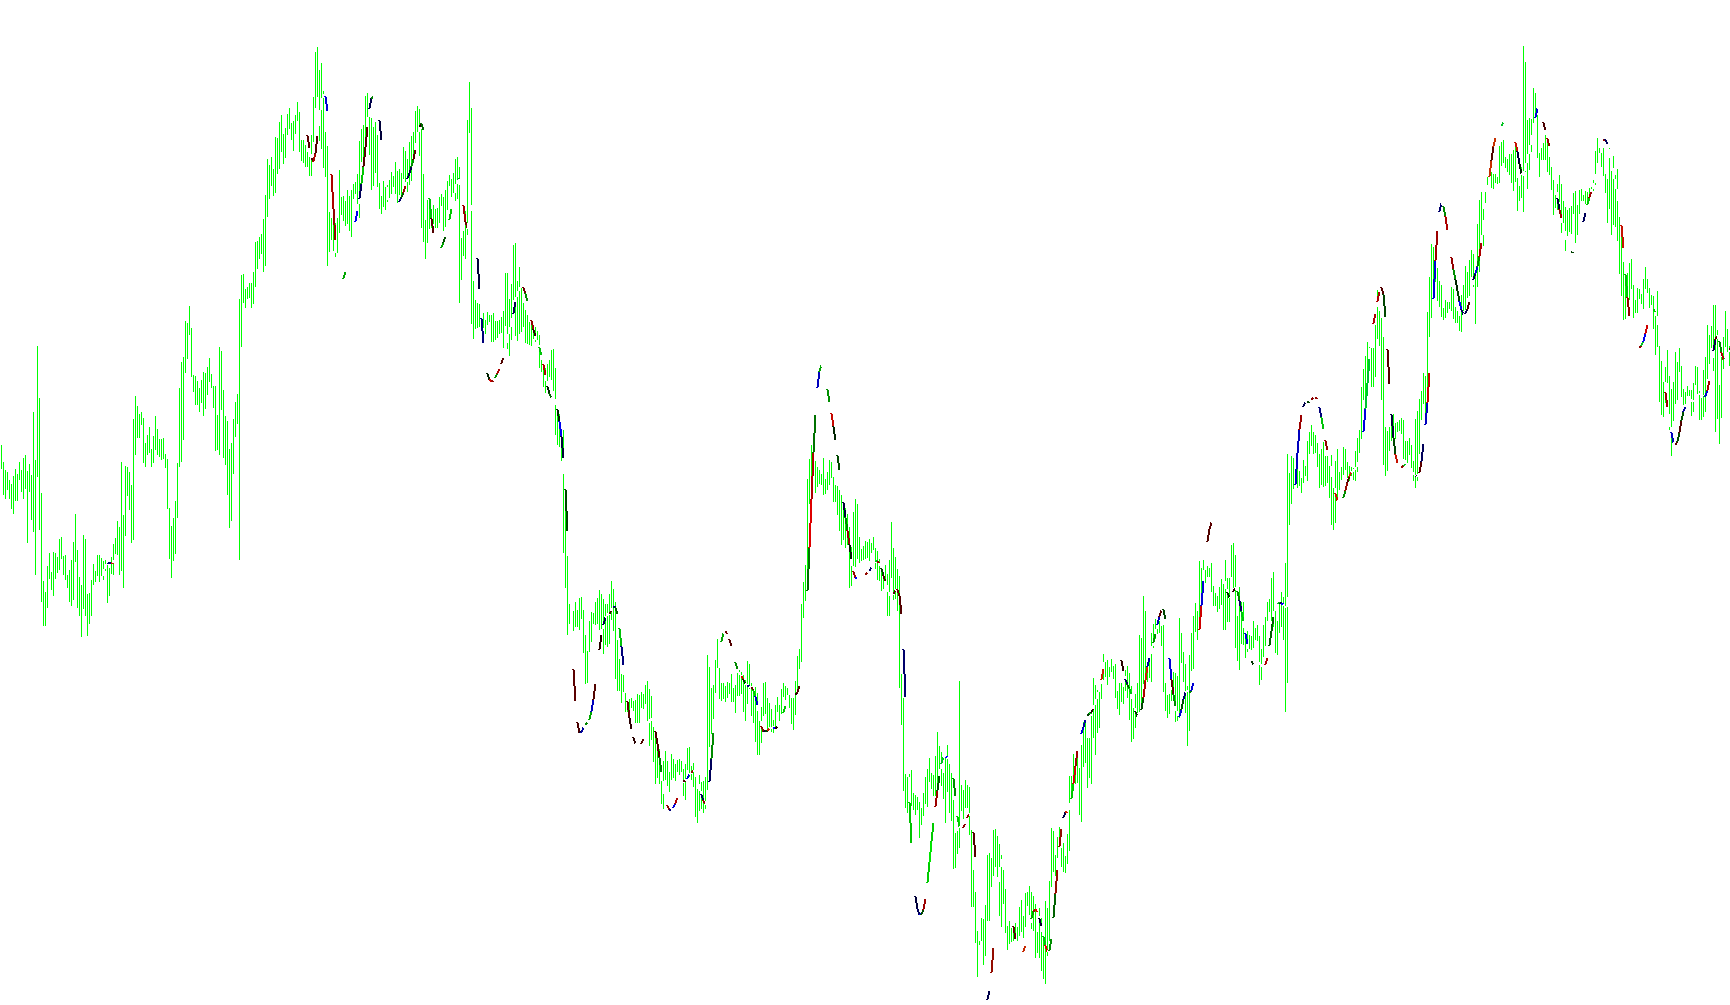
This indicator calculates a high-order smoothing moving average using the Tim Tillson T3 algorithm, augmented by an Inverse Fisher Transform of the rate of change normalized by ATR to determine dynamic trend momentum.
Pretty_t3_LK_V1.3
Indicator

Pretty_t3_LK_V1.3

iATRiMA

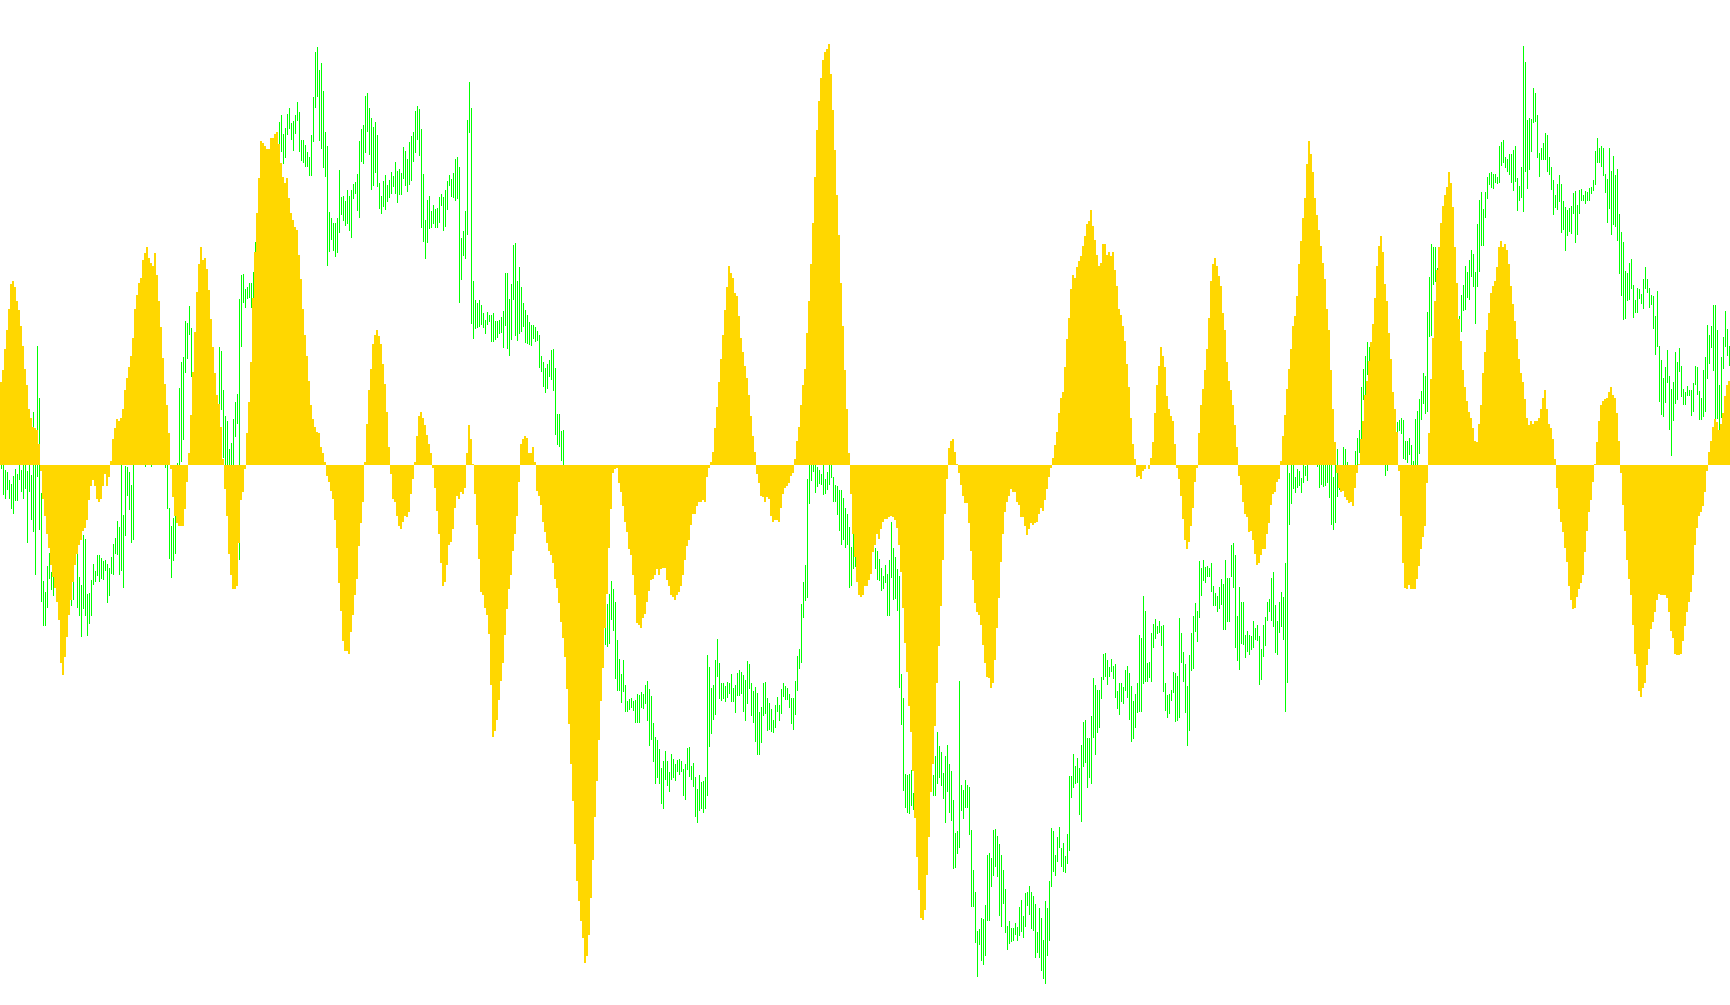
This indicator calculates a high-order smoothed moving average using the Tillson T3 algorithm combined with a Fisher Transform filter to visualize trend velocity and momentum intensity via dynamic color shifting.

Price Crosses MA
Indicator

Price Crosses MA

iMA

This indicator identifies trend reversals by detecting when price action breaches a specific pip buffer beyond the calculated moving average.

Price Oscillator
Indicator

Price Oscillator

iMA

This indicator calculates the numerical variance between two distinct moving averages of varying periods and smoothing methods to visualize price momentum as a histogram.

Price range information
Indicator

Price range information

iCCIiMACDiRSIiStochastic

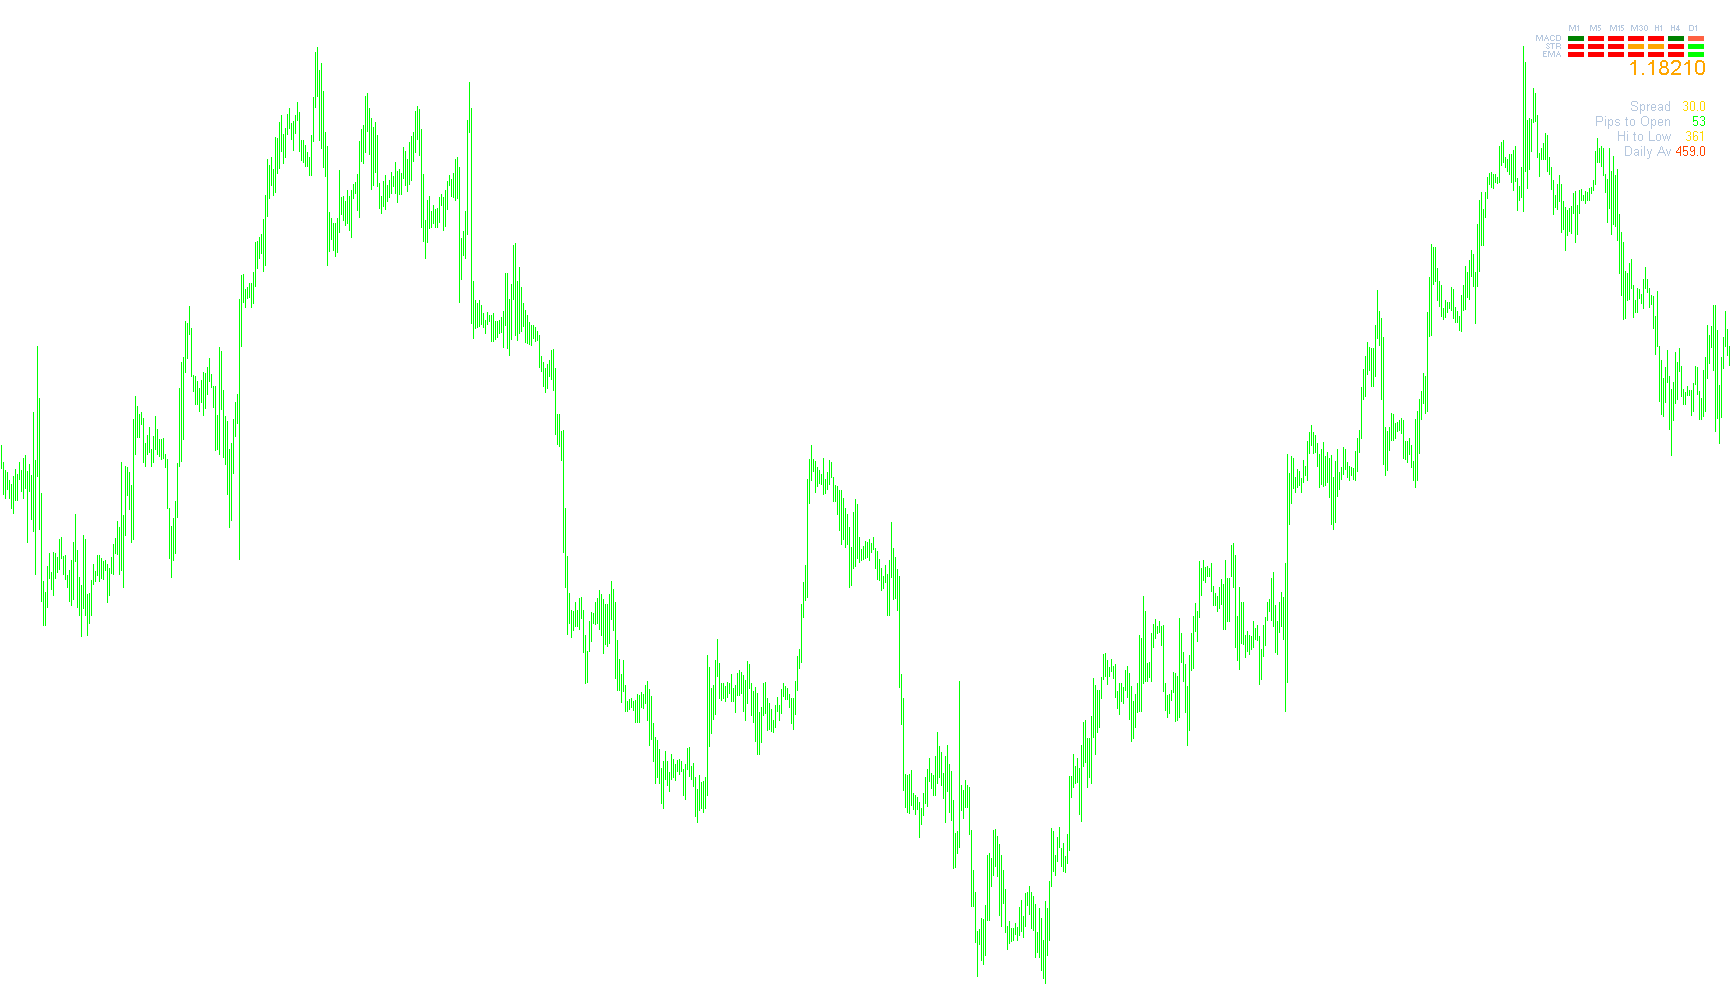
This indicator aggregates real-time data from multiple timeframes to provide a visual dashboard of MACD, RSI, Stochastic, CCI, and EMA trends simultaneously.

PriceActionChanel
Indicator

PriceActionChanel

iMA

This indicator calculates upper and lower price boundaries by applying a percentage deviation to the Smoothed Moving Average of the high and low prices respectively.

PriceChannel_Signal_v1
Indicator

PriceChannel_Signal_v1

iATRiMA

This indicator identifies trend reversals and momentum continuations by monitoring price breaches of volatility-adjusted upper and lower boundaries based on high/low extremes.

PriceCounter
Indicator

PriceCounter

iMA

This indicator renders a real-time visual display of the current Exponential Moving Average price and an incrementing tick counter directly on the chart workspace.

PriceInfo
Indicator

PriceInfo

iMA

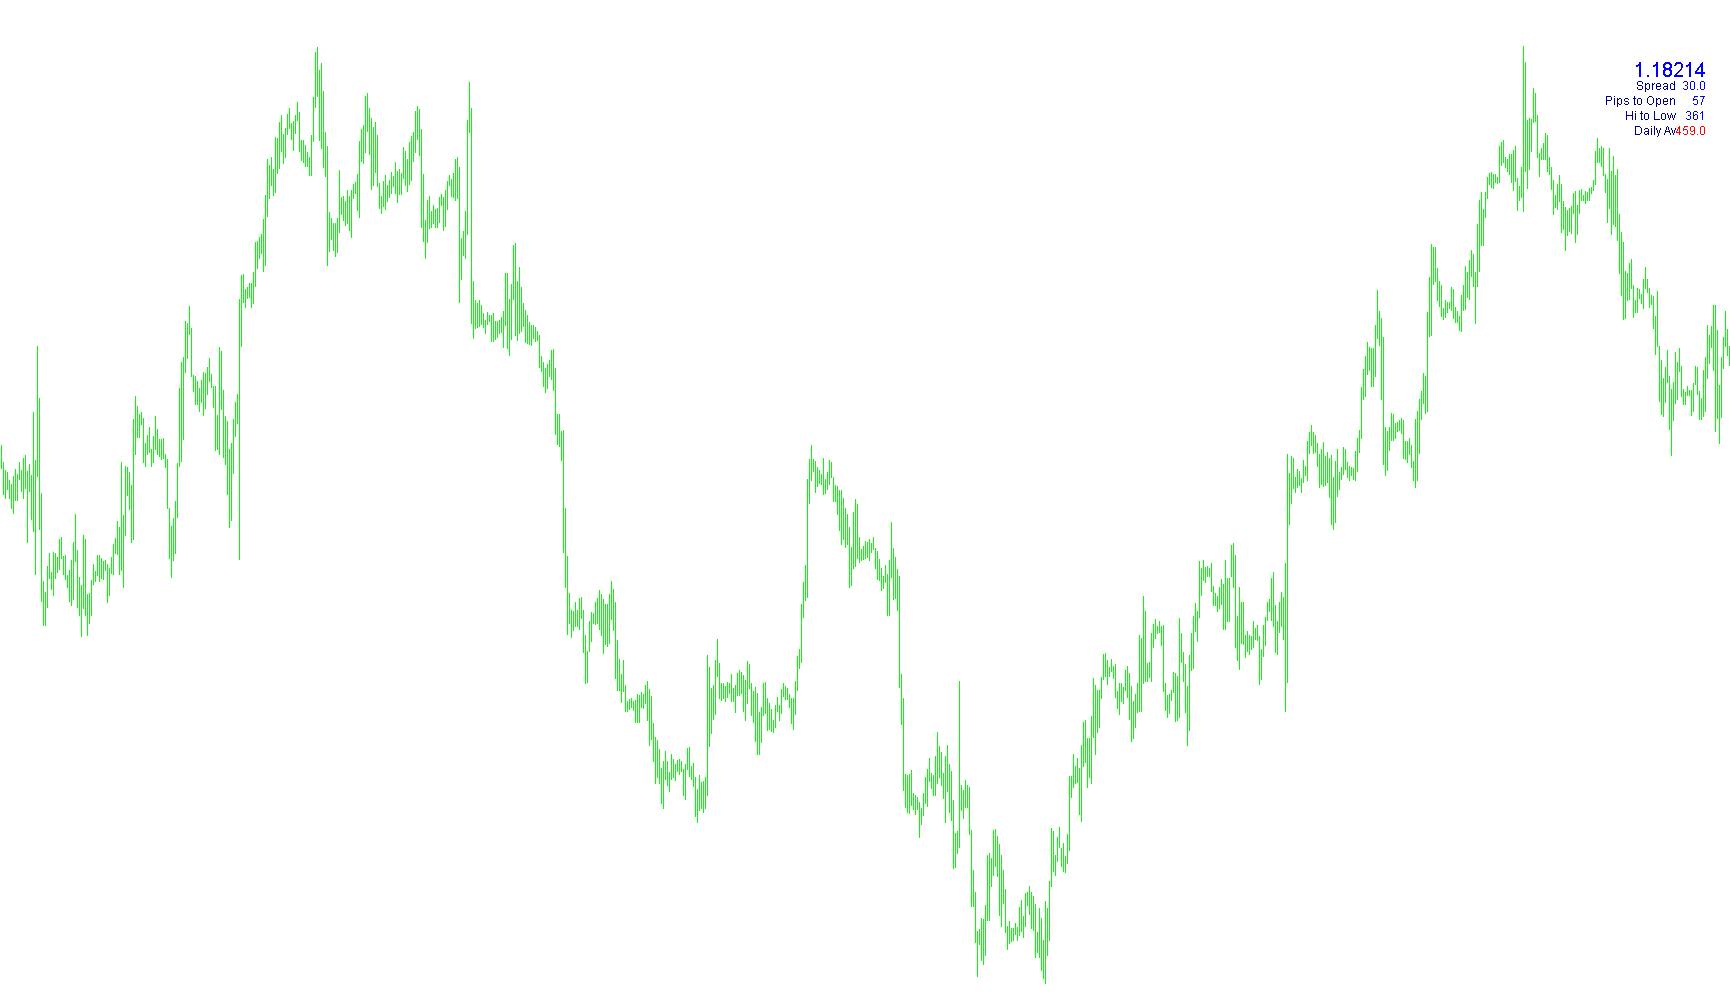
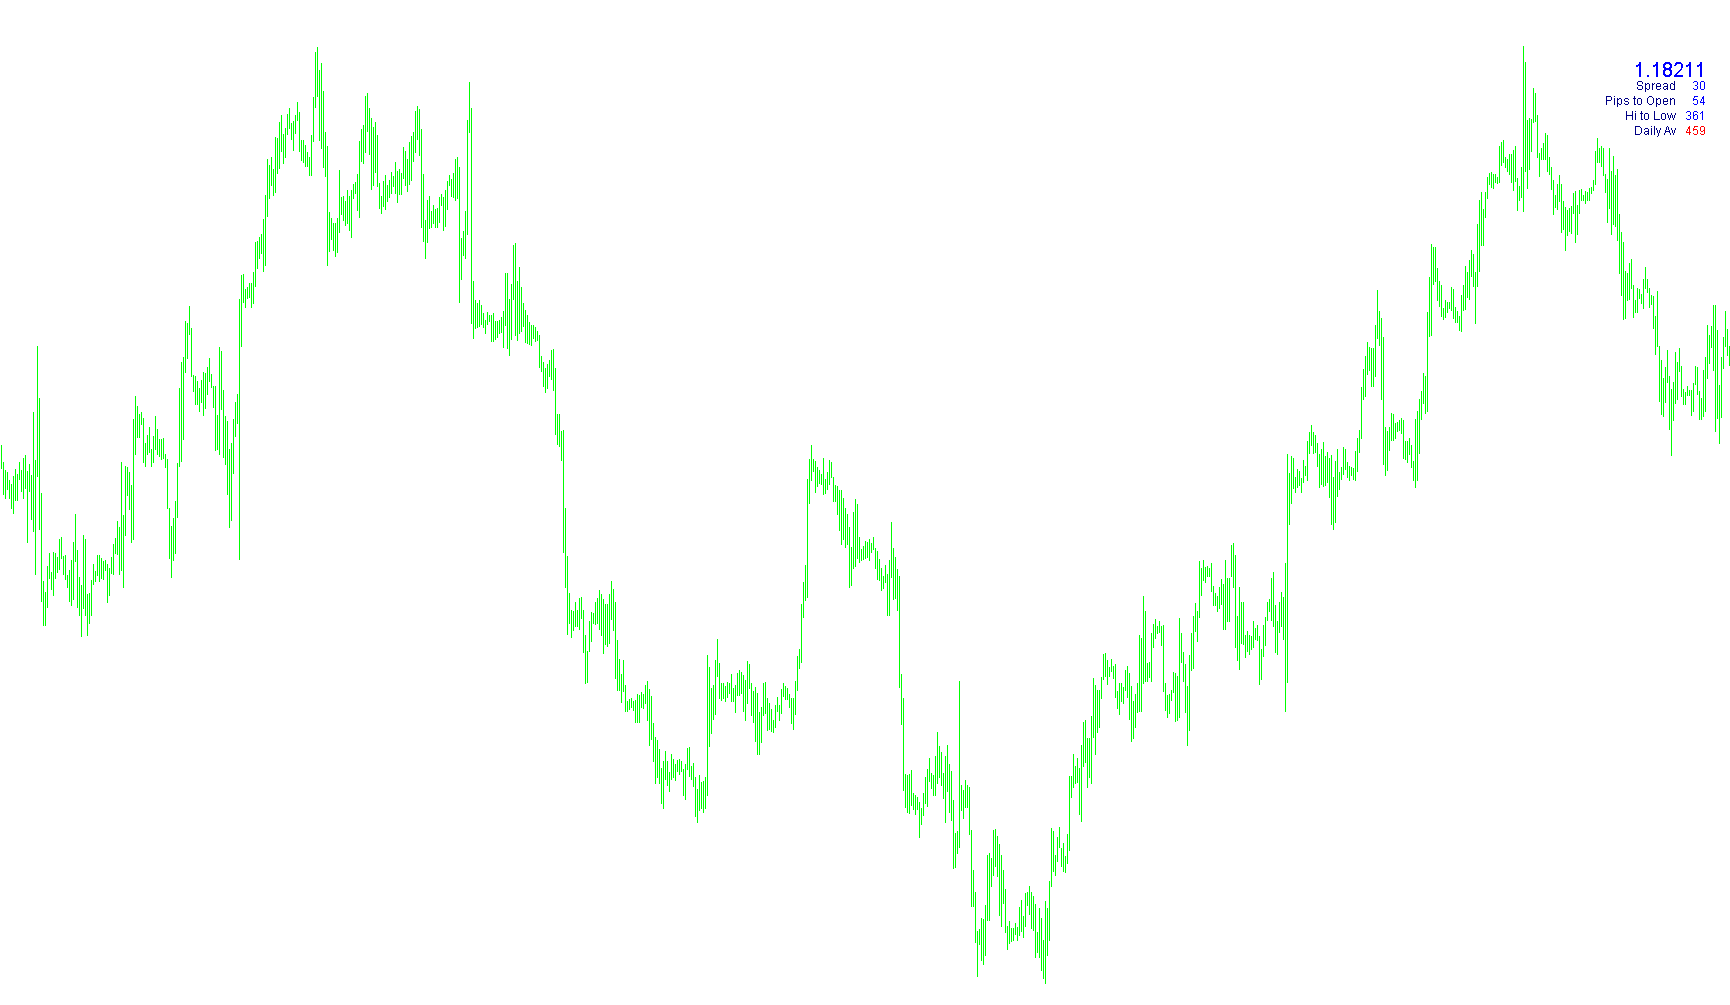
A comprehensive on-chart dashboard that visualizes real-time spread, pip variance from open, and a multi-period daily average range for precise volatility monitoring.

PriceInfo2
Indicator

PriceInfo2

iMA

This indicator calculates and displays real-time daily statistics, including average price range volatility over multiple lookback periods, current spread, and price progression from the session open.