Raghee5minutes
Indicator

Raghee5minutes

iMA

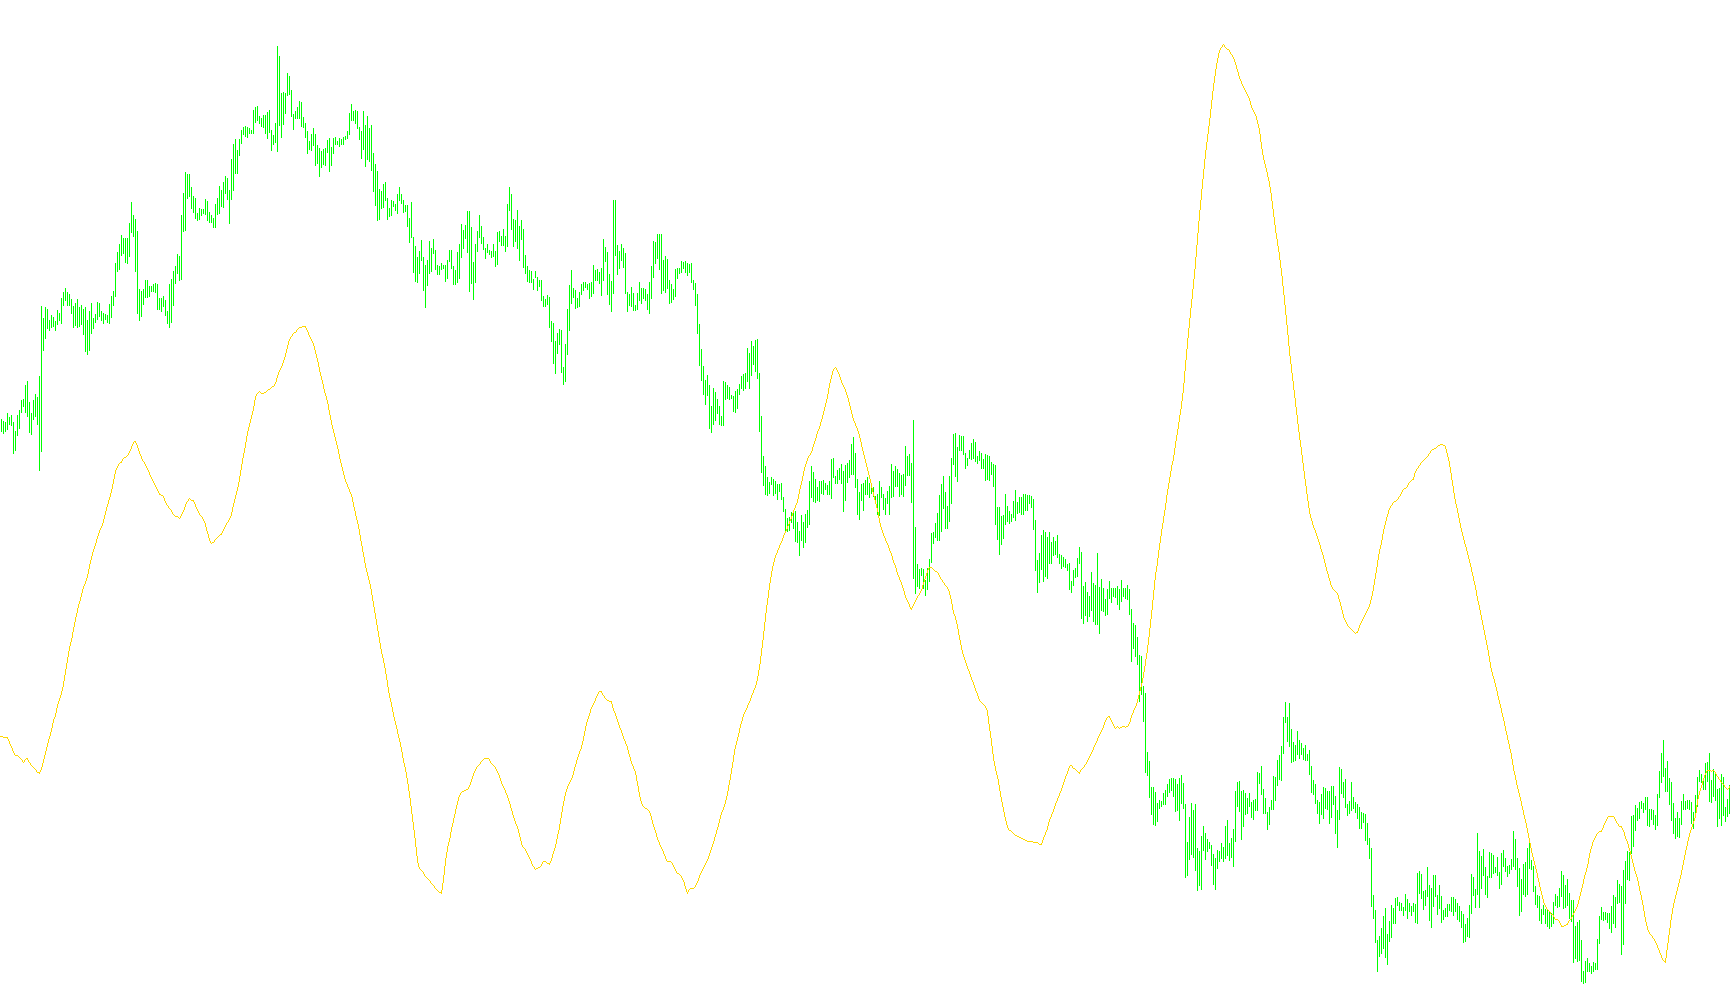
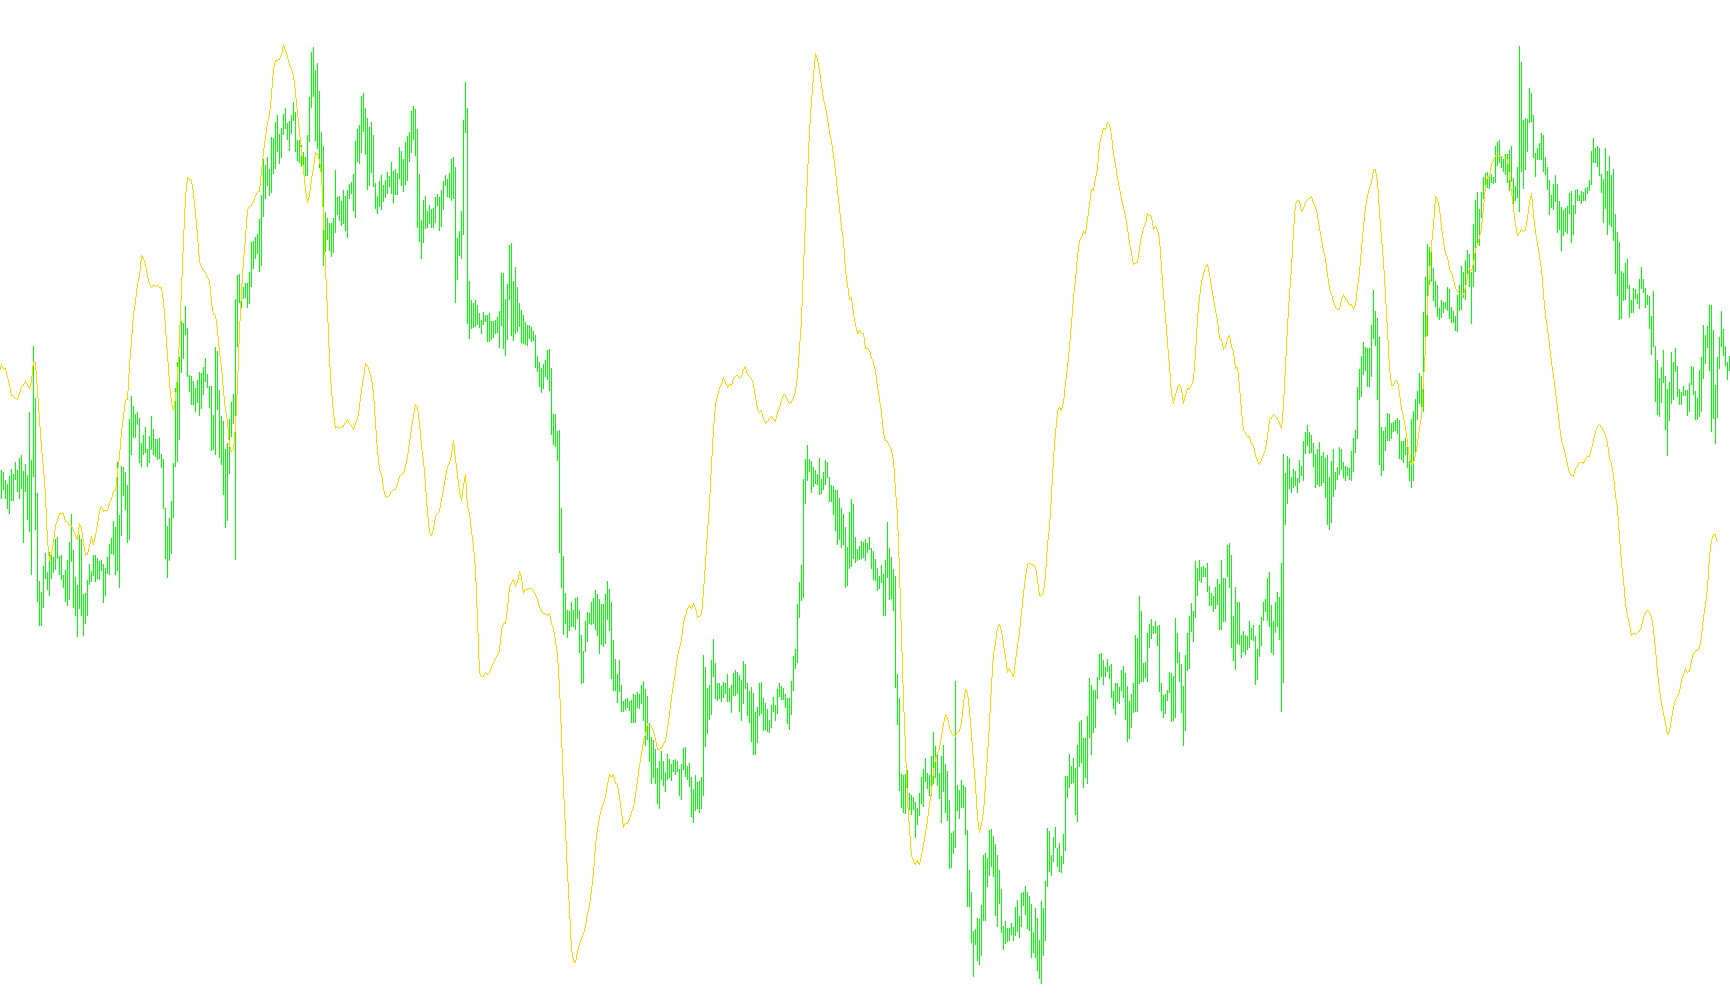
This indicator calculates exponential moving averages while dynamically switching between high and low price sources based on the trigonometric angle of a 60-minute trend slope.

RagheeCandleVagueBars
Indicator

RagheeCandleVagueBars

iMA

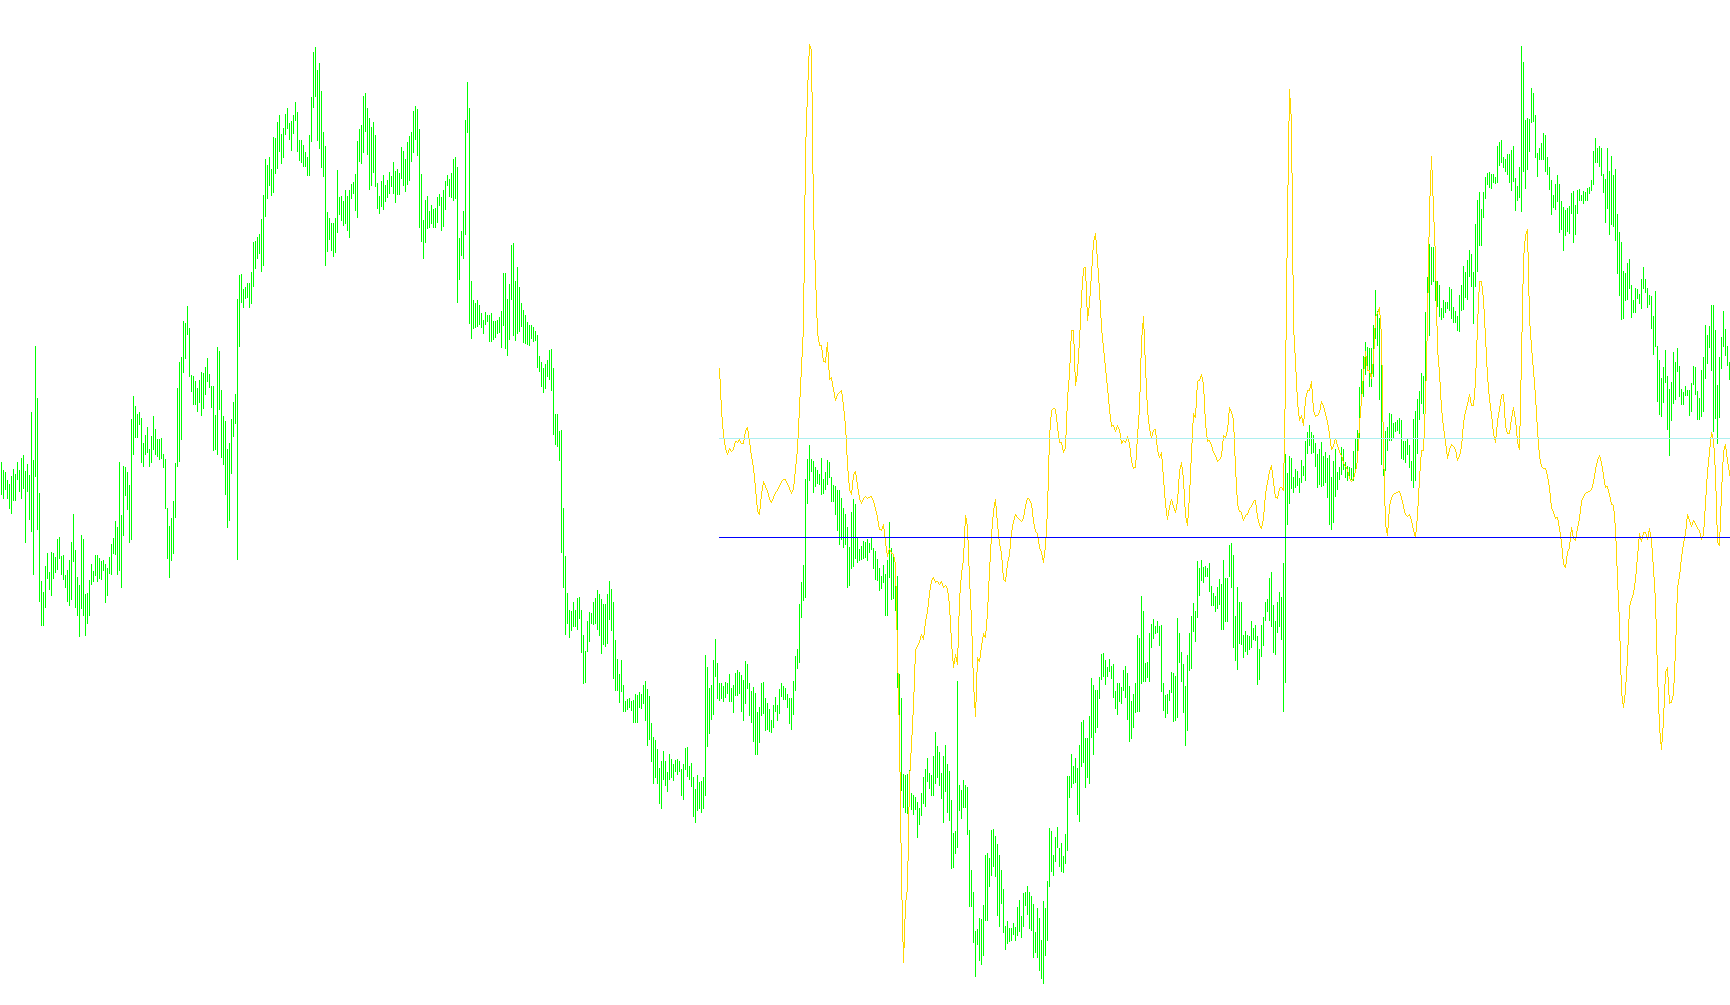
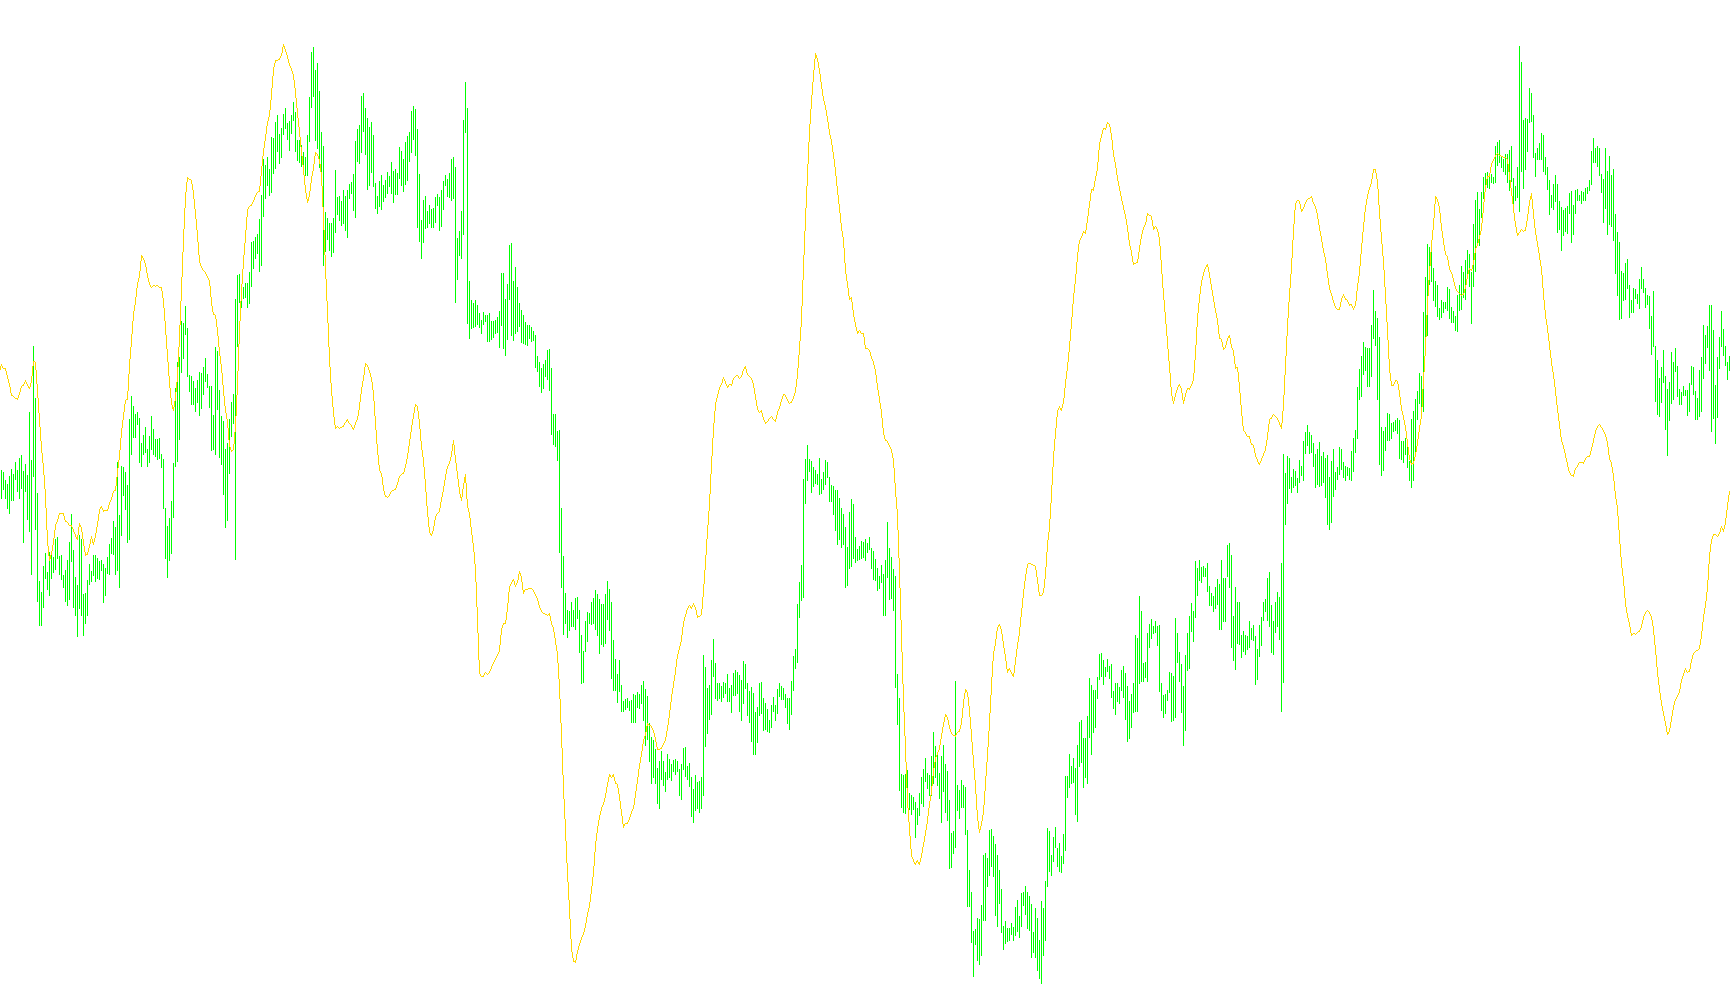
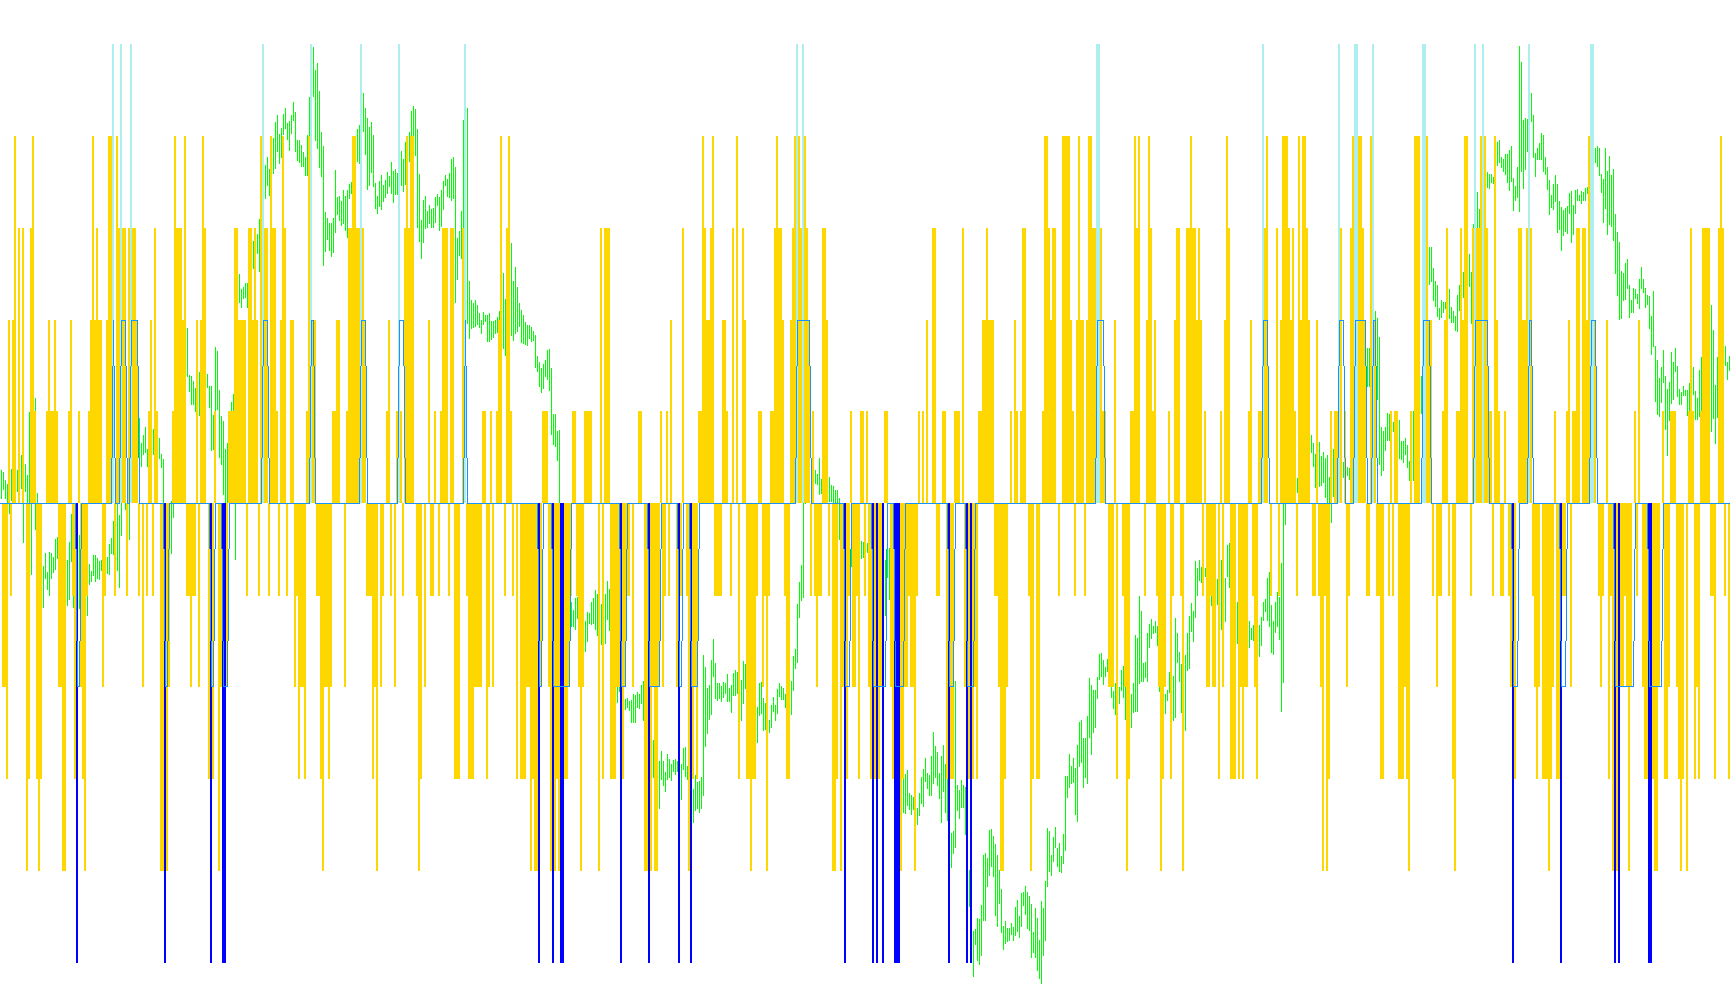
This indicator identifies directional bias by calculating the arctangent of Exponential Moving Average slopes and filtering them against predefined angular thresholds to highlight significant trend momentum.

RainbowMMA
Indicator

RainbowMMA

iMA

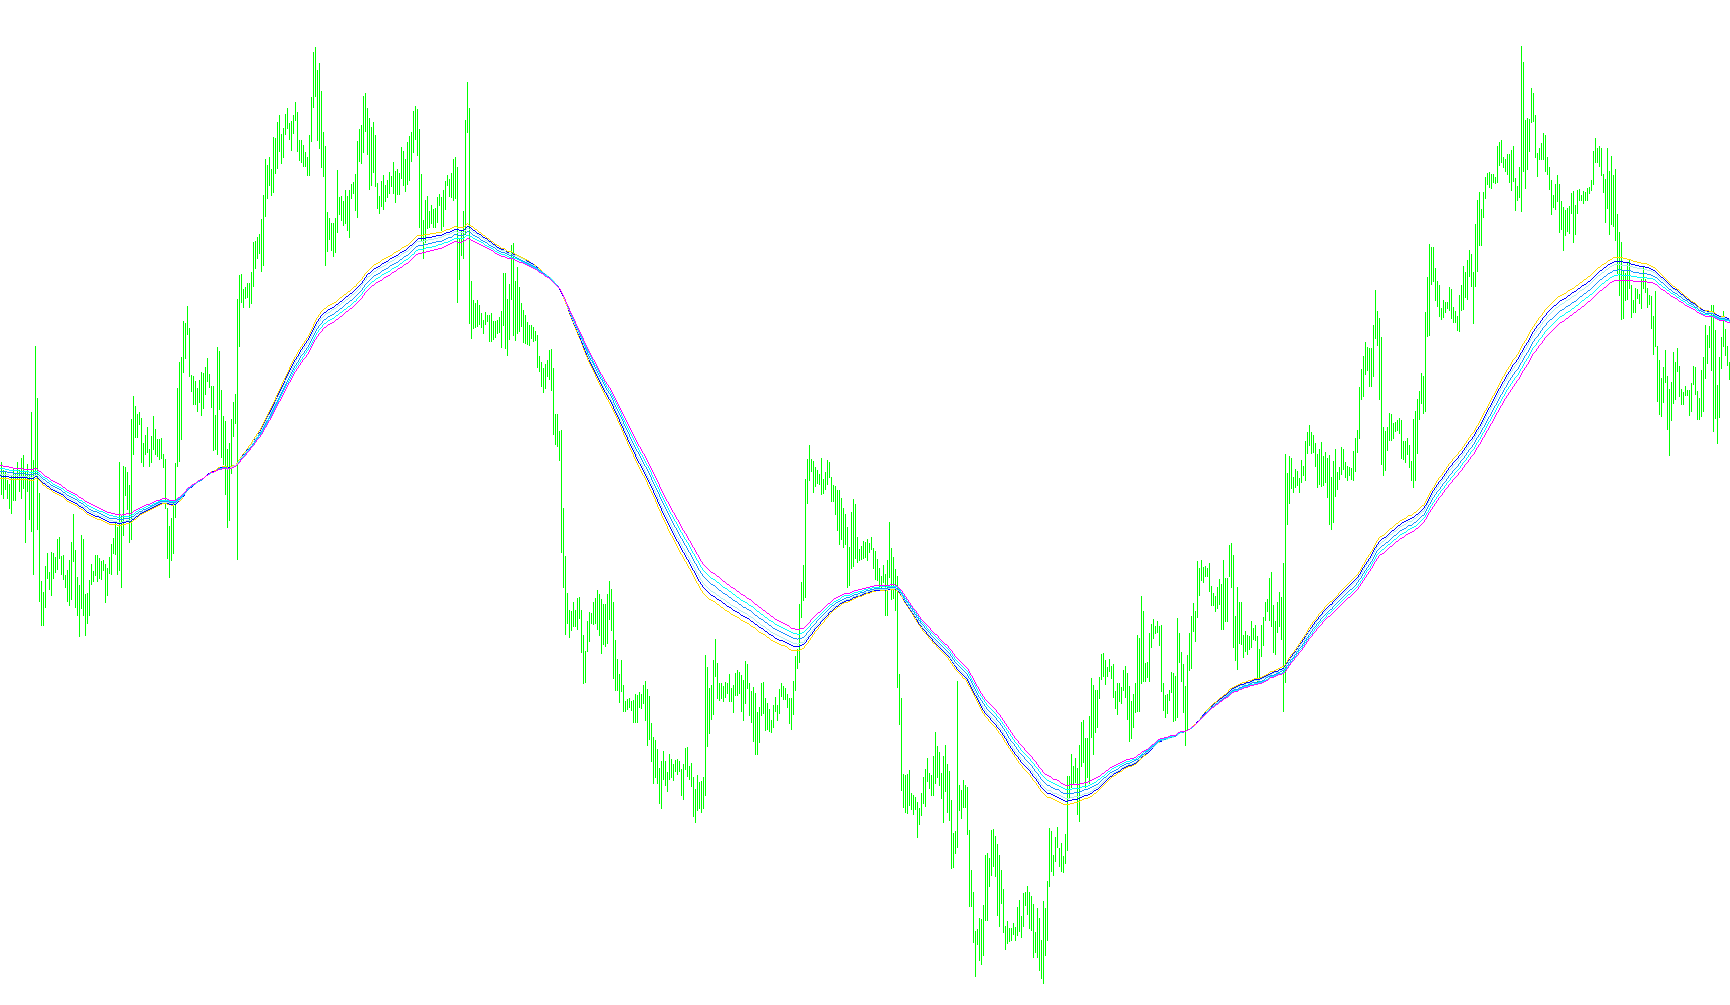
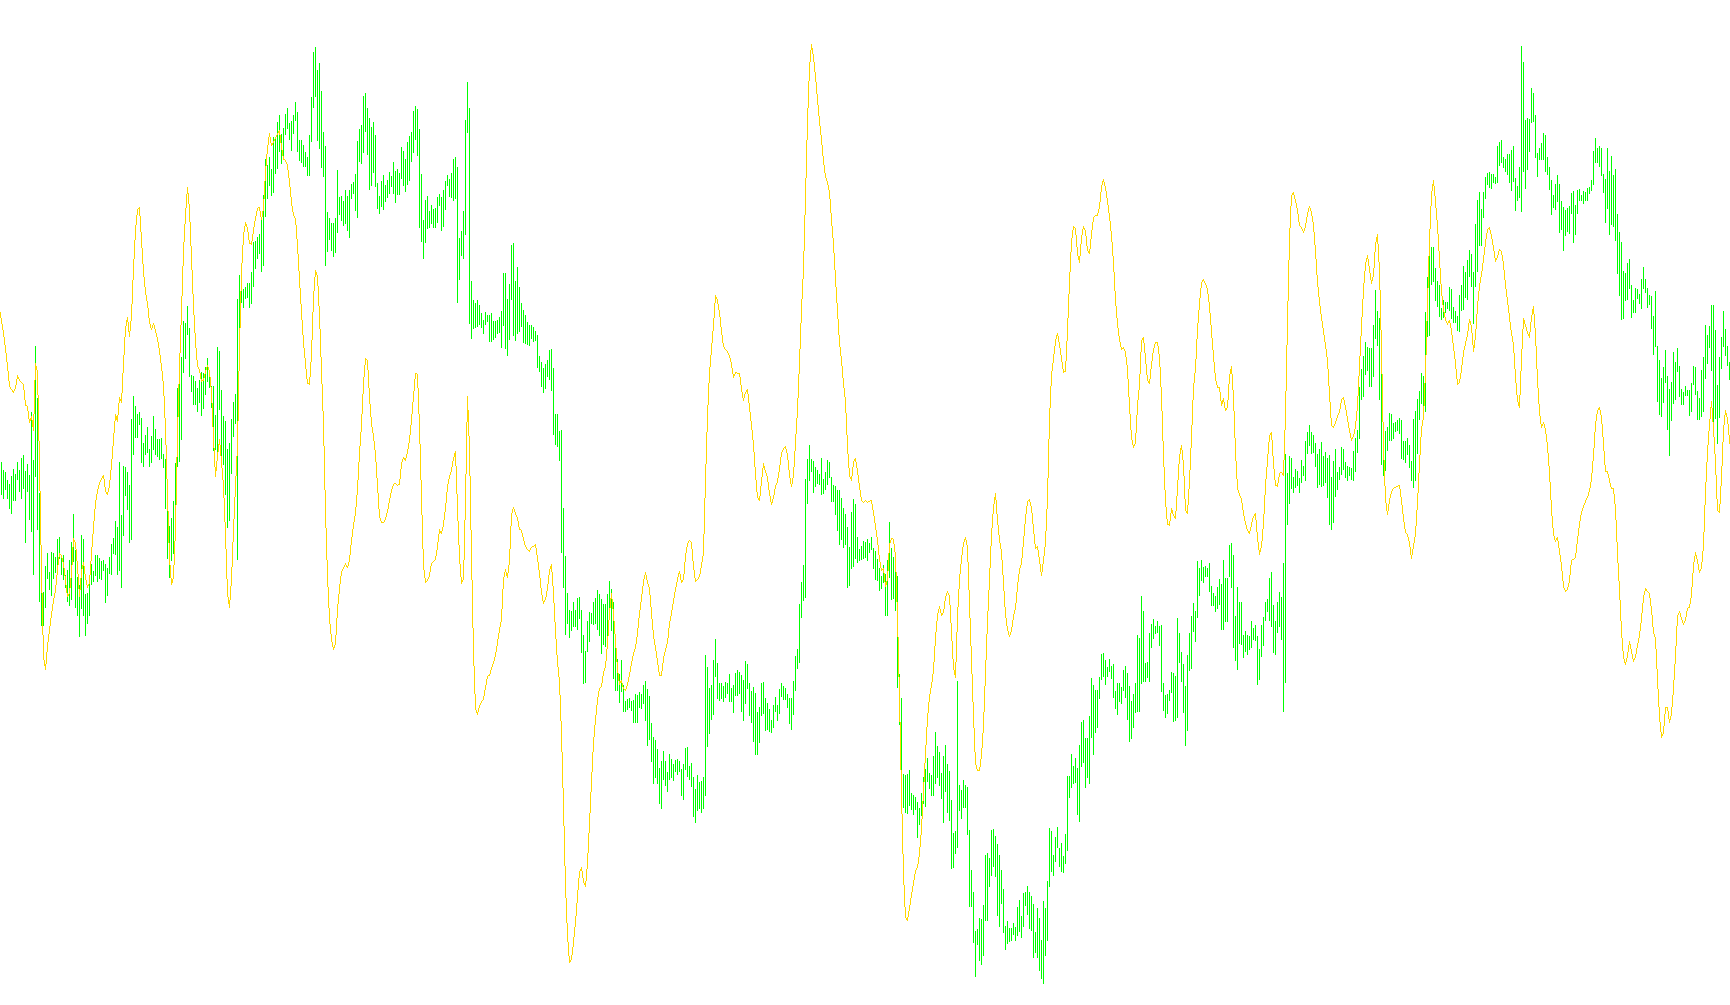
This indicator maps eight exponential moving averages across progressively expanding timeframes to visualize overarching trend dynamics and price momentum.

RainbowMMA_01
Indicator

RainbowMMA_01

iMA

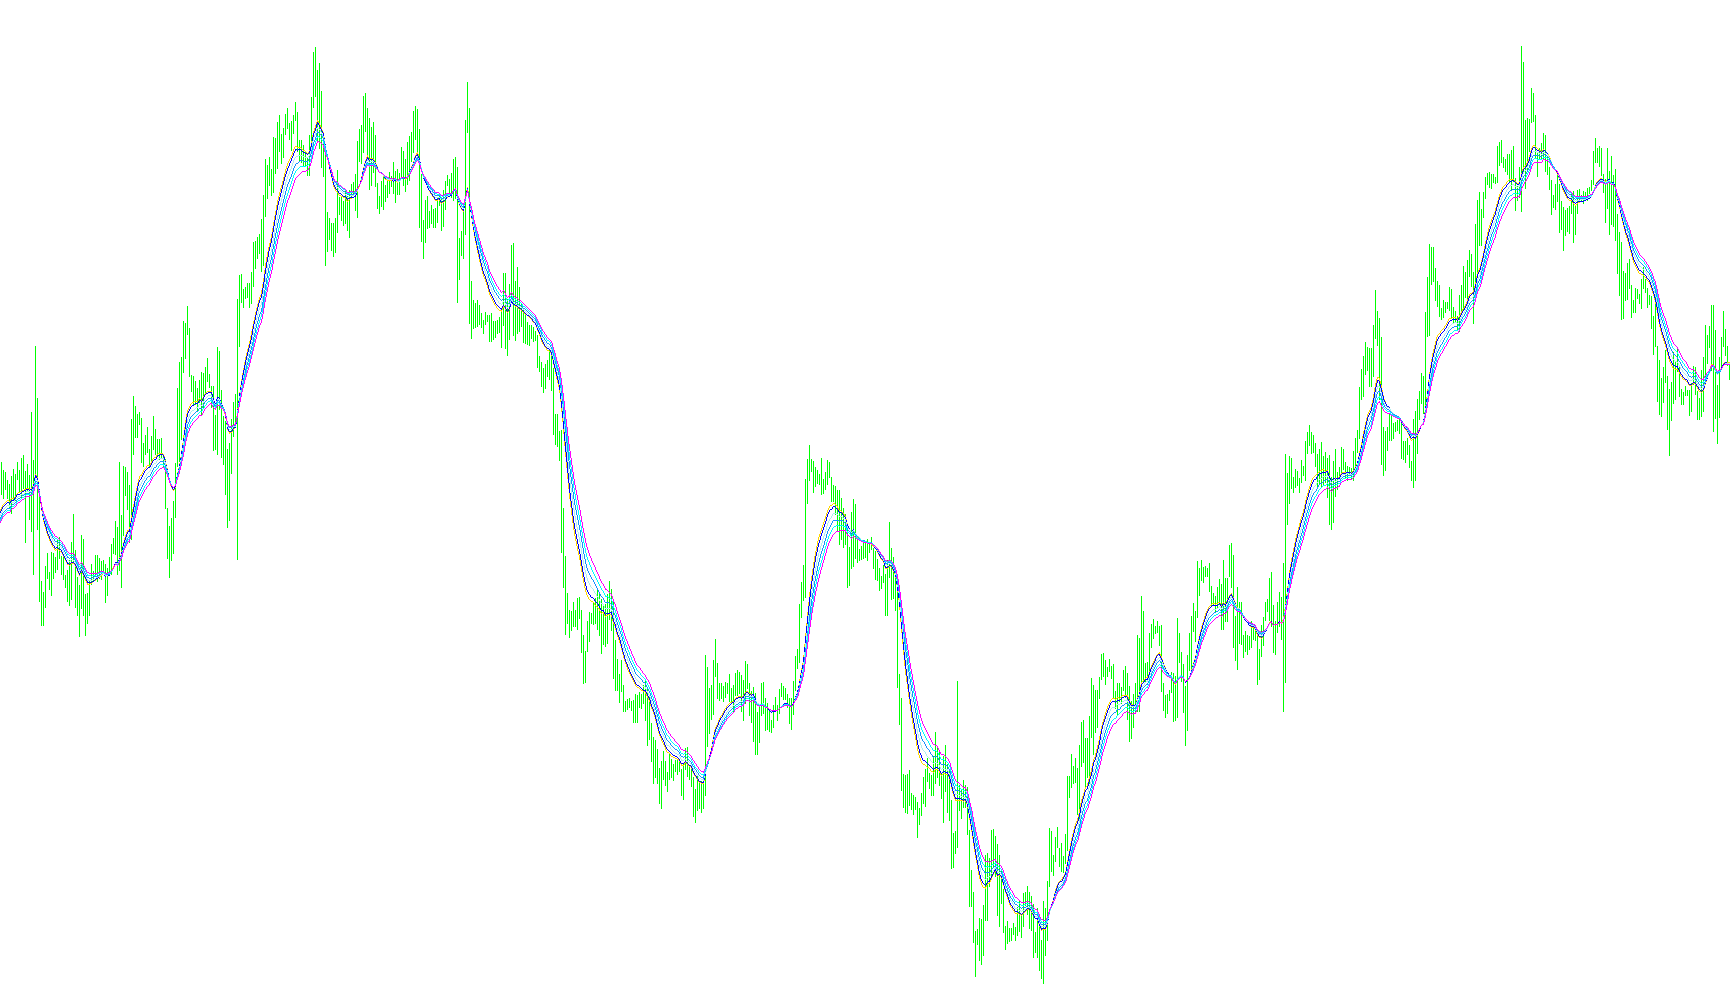
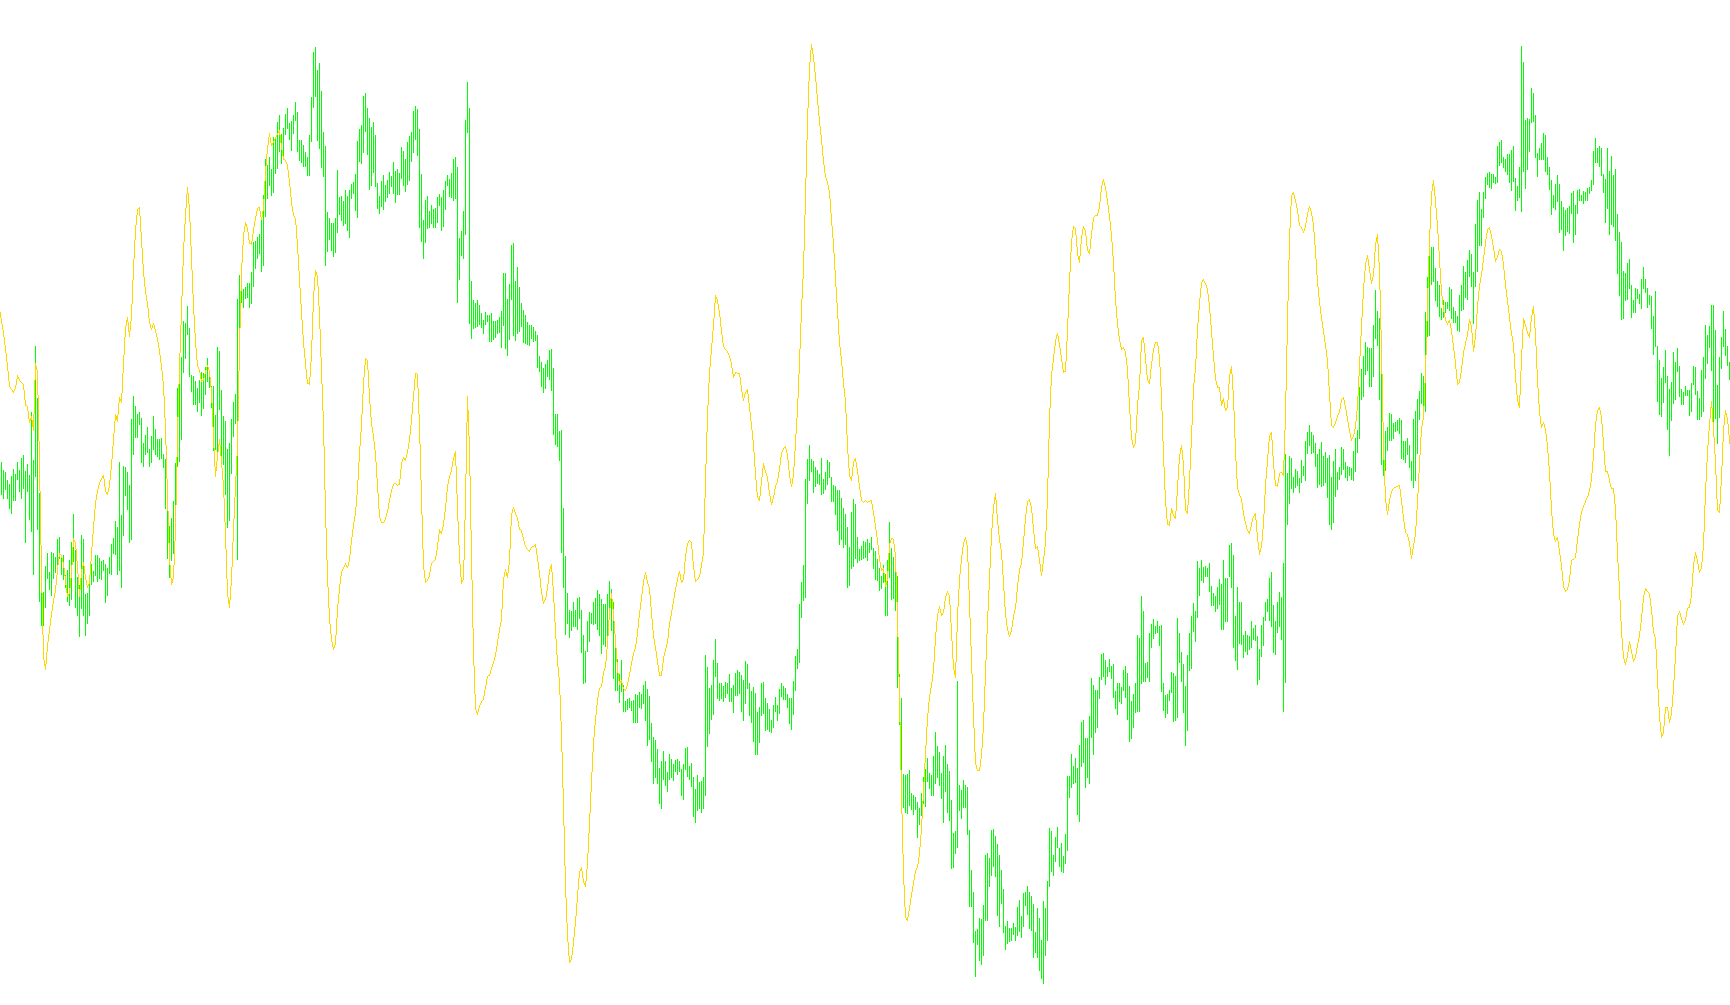
This indicator visualizes a multi-layered sequence of exponential moving averages with staggered periods to identify overarching trend momentum and price convergence.

RainbowMMA_02
Indicator

RainbowMMA_02

iMA

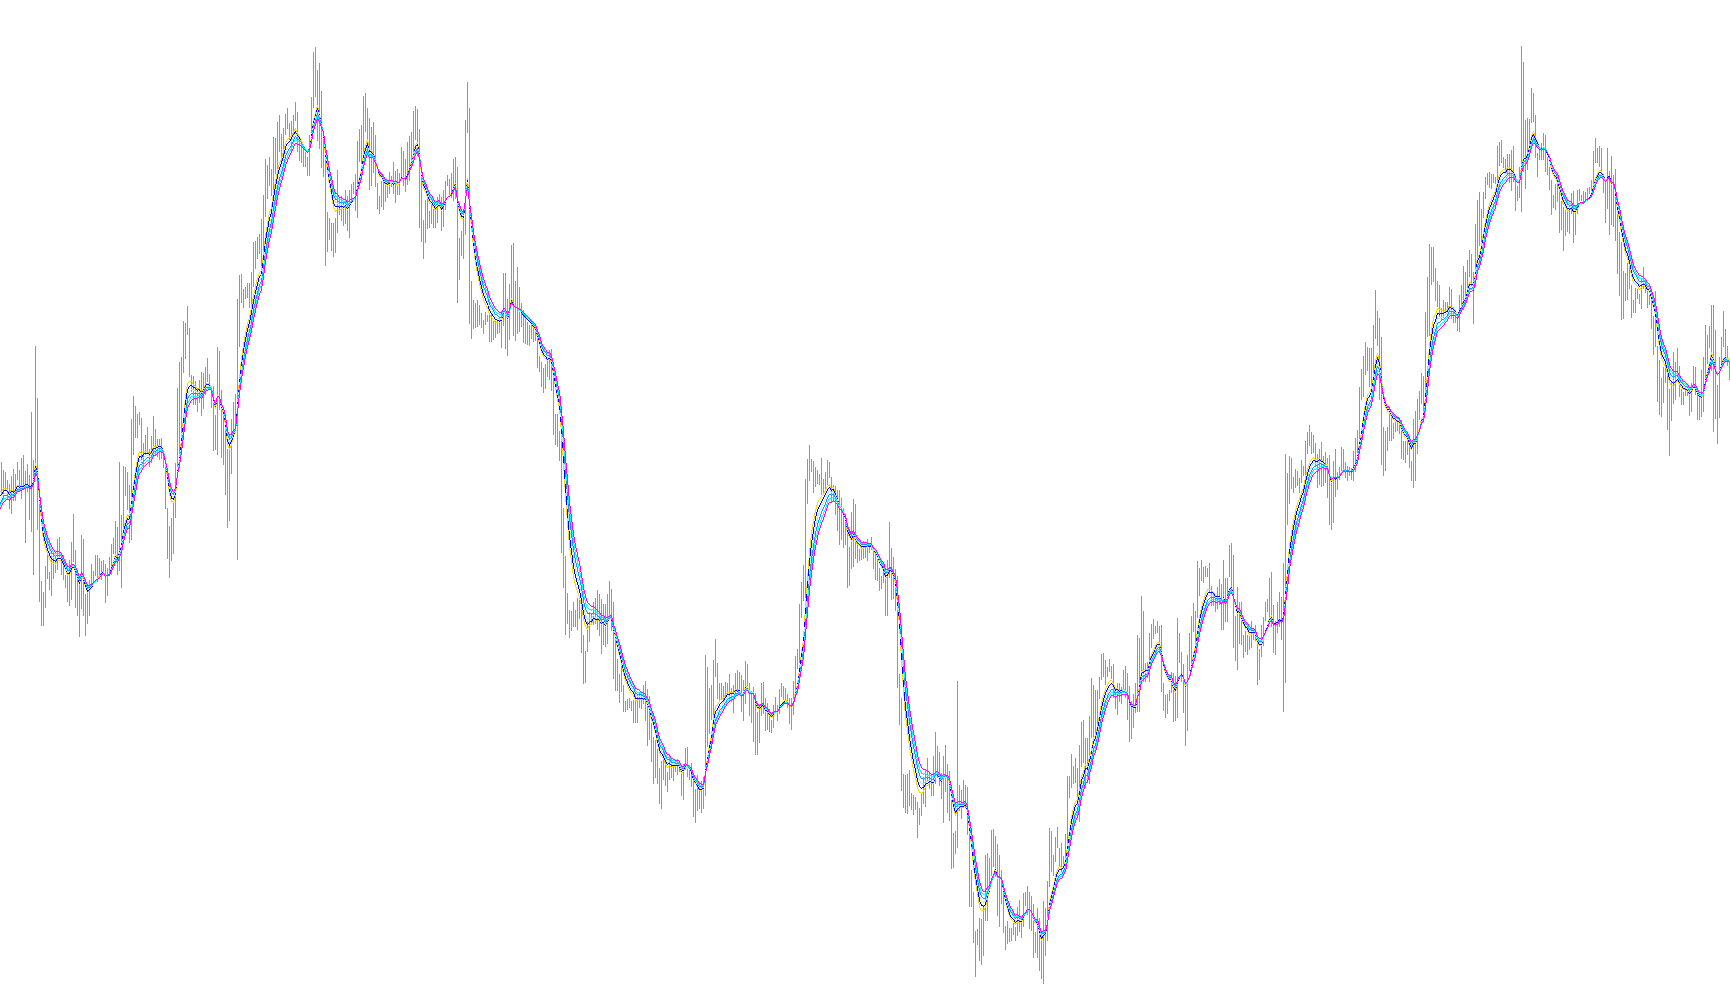
This indicator plots a series of eight multi-period exponential moving averages to visualize structural price momentum and trend confluence.

RainbowMMA_03
Indicator

RainbowMMA_03

iMA

This indicator maps multiple exponential moving averages with incrementally increasing periods to visualize trend velocity and price equilibrium.

RainbowMMA_04
Indicator

RainbowMMA_04

iMA

This indicator visualizes a multi-layered sequence of exponential moving averages to identify momentum shifts and structural trend transitions through ribbon convergence.

RainbowMMA_05
Indicator

RainbowMMA_05

iMA

This indicator visualizes a multi-layered sequence of exponential moving averages with varying periods to identify trend curvature and momentum shifts.

RainbowMMA_06
Indicator

RainbowMMA_06

iMA

This indicator visualizes price momentum and trend direction by plotting a series of eight distinct exponential moving averages with progressively increasing periods.

RainbowMMA_07
Indicator

RainbowMMA_07

iMA

This indicator renders a multi-layered stack of six Exponential Moving Averages with staggered periods to visualize trend momentum and structural fluidity.

RainbowMMA_08
Indicator

RainbowMMA_08

iMA

This indicator renders a multi-layered ribbon of eight distinct Exponential Moving Averages with incrementally increasing periods to visualize trend momentum and structural density.

RainbowMMA_09
Indicator

RainbowMMA_09

iMA

This indicator visualizes price momentum by plotting a series of multi-period Exponential Moving Averages to identify trend direction and structural confluence.

RainbowMMA_10
Indicator

RainbowMMA_10

iMA

This indicator visualizes a multi-layered sequence of progressively increasing Exponential Moving Averages to identify trend curvature and price momentum.

RainbowMMA_11
Indicator

RainbowMMA_11

iMA

This indicator synthesizes a multi-layered ensemble of exponential moving averages to visualize momentum trends and structural price fluidity.

RainbowOsMA
Indicator

RainbowOsMA

iMAiMAOnArray

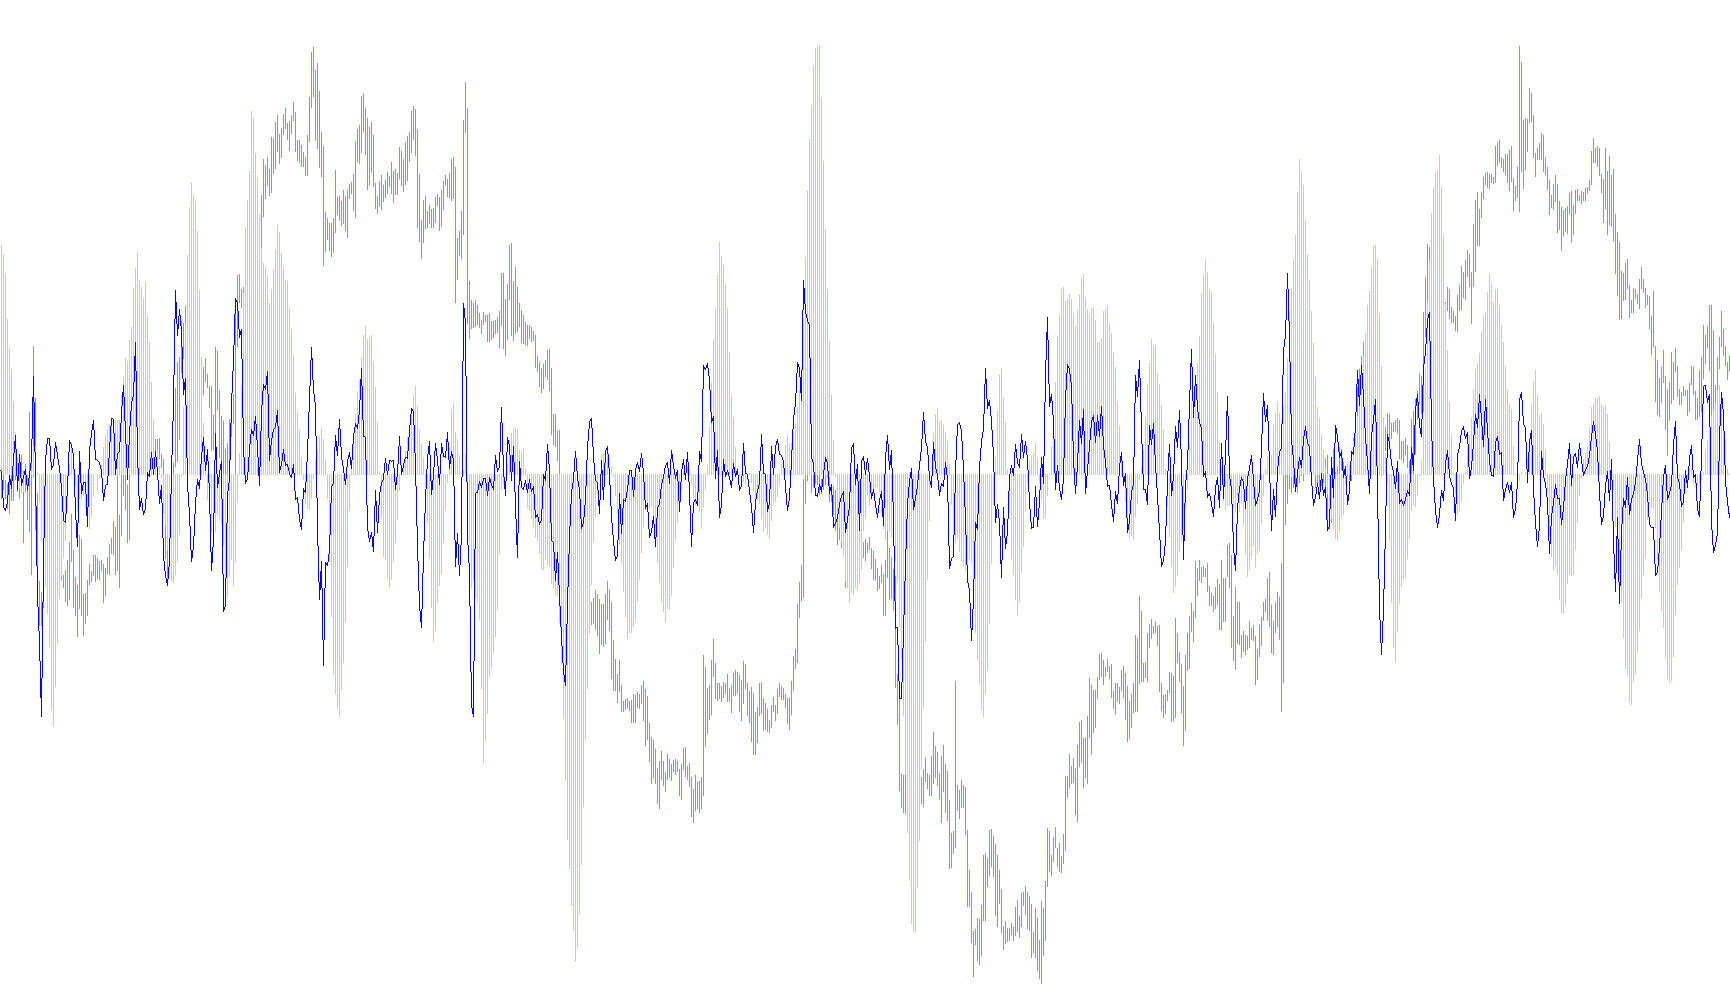
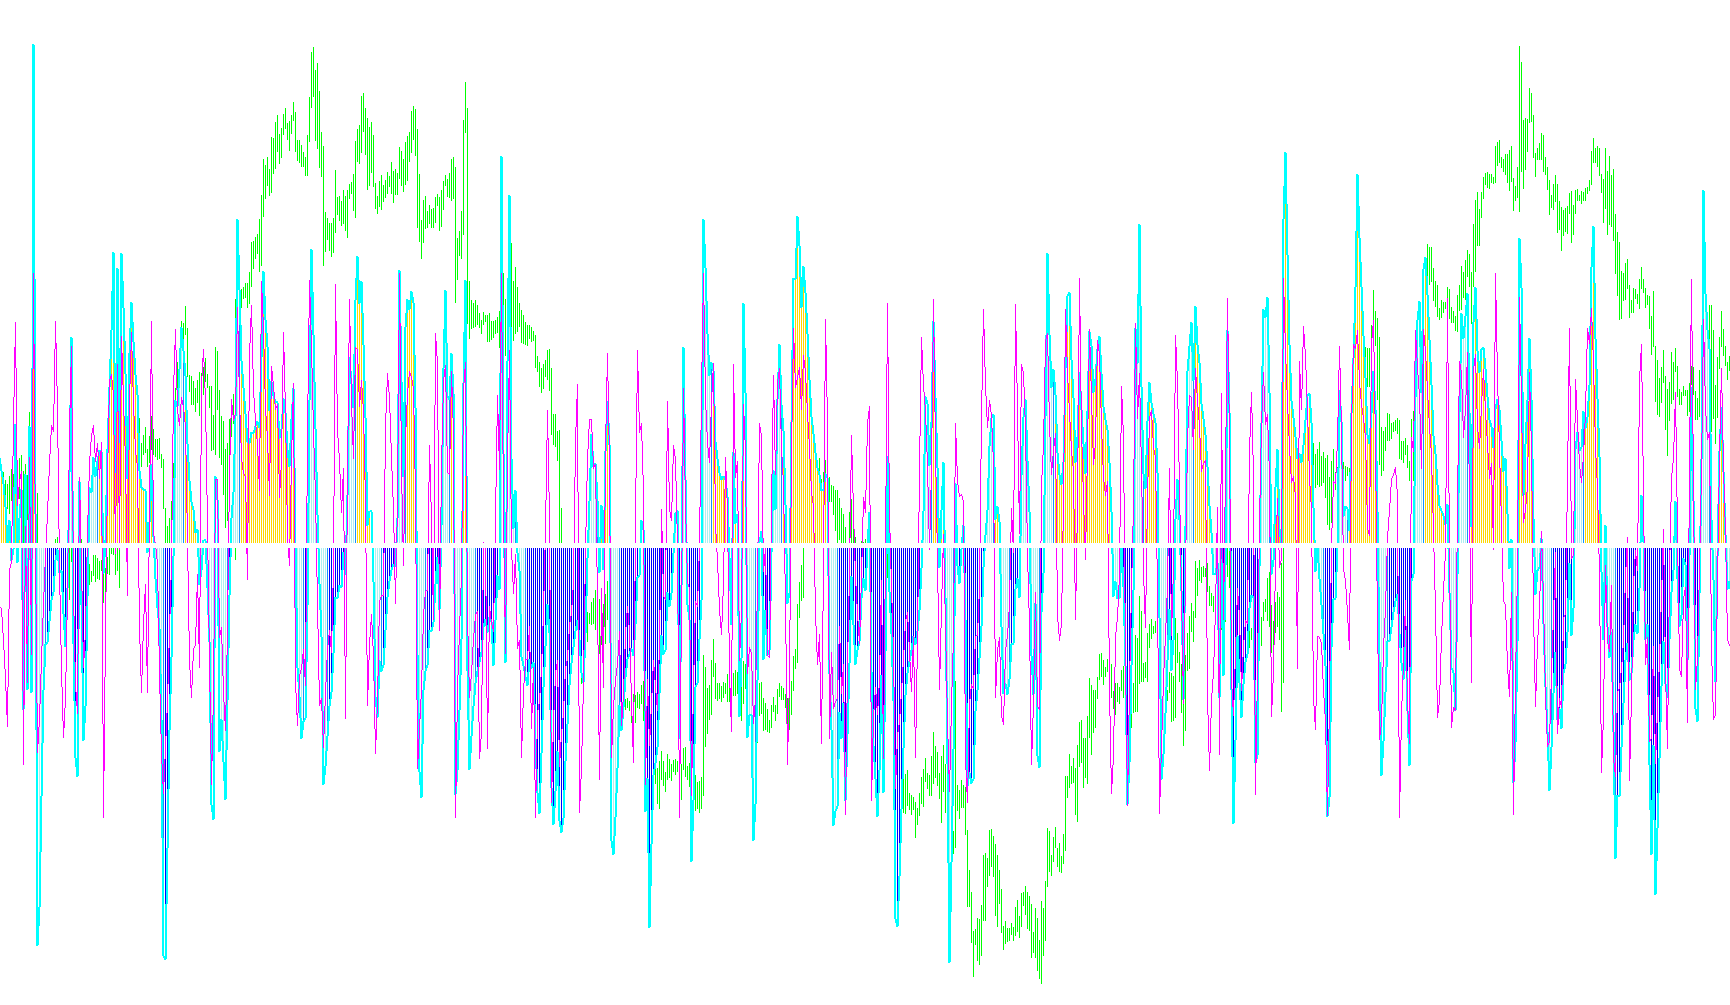
This indicator visualizes price momentum by calculating the difference between two exponential moving averages and applying a signal smoothing layer with specific threshold-based color transitions.

RainbowOsMA_v1
Indicator

RainbowOsMA_v1

iMAiMAOnArray

This indicator calculates a dual-EMA differential signal and applies a threshold filtering logic to isolate significant momentum shifts into distinct visual histogram components.

RangeBoundMA
Indicator

RangeBoundMA

iMA

This indicator calculates the absolute maximum price differential between three distinct Simple Moving Averages to identify and visualize market consolidation zones.

RangerBB
Indicator

RangerBB

iMAiMAOnArrayiStdDevOnArray

This indicator calculates a synthetic price deviation by summing the difference between closing prices and moving averages of high and low extremes, then overlaying a Bollinger Band envelope on the resulting signal.

RAVI FX Fisher
Indicator

RAVI FX Fisher

iATRiMA

This indicator calculates a normalized momentum value by scaling the difference between two Linear Weighted Moving Averages against their respective ATR volatility, optionally applying an Inverse Fibonacci Transform for smoother trend identification.

RAVI FX Fisher2
Indicator

RAVI FX Fisher2

iATRiMA

This indicator transforms the spread between two Linear Weighted Moving Averages into a hyperbolic tangent function to normalize price momentum and volatility into an oscillatory range.

RAVI FX Fisher2_v1
Indicator

RAVI FX Fisher2_v1

iATRiMA

This indicator quantifies price velocity by calculating the exponential transformation of linear weighted moving average differentials normalized against volatility.

RAVI FX Fisher_001
Indicator

RAVI FX Fisher_001

iATRiMA

This indicator quantifies price velocity by calculating the normalized difference between fast and slow linear weighted moving averages, optionally applying a hyperbolic tangent transformation to stabilize extreme variance.

RAVI FX Fisher_v1
Indicator

RAVI FX Fisher_v1

iATRiMA

This indicator quantifies price momentum by calculating the normalized variance between two linear weighted moving averages adjusted by Average True Range volatility.

RAVI FX Fisher_v2
Indicator

RAVI FX Fisher_v2

iATRiMA

This indicator calculates a normalized momentum value by processing the relative distance between fast and slow linear weighted moving averages adjusted by volatility, then maps it onto a hyperbolic tangent curve.

RAVI FX Fisher_v3
Indicator

RAVI FX Fisher_v3

iATRiMA

This indicator normalizes the distance between two linear weighted moving averages relative to volatility, then applies a hyperbolic tangent transformation to map momentum into a bounded range.

RAVI FX Fisher_v4
Indicator

RAVI FX Fisher_v4

iATRiMA

This indicator quantifies price velocity by normalizing the spread between a fast and slow linear weighted moving average against their respective average true ranges, mapped through a hyperbolic tangent function.

RAVI FX Fisher_v5
Indicator

RAVI FX Fisher_v5

iATRiMA

This indicator quantifies relative price velocity by normalizing the spread between linear weighted moving averages against average true range volatility and mapping the result onto a hyperbolic tangent curve.

RAVI FX
Indicator

RAVI FX

iATRiMA

This indicator transforms the normalized price momentum between two linear weighted moving averages into a bounded distribution to identify trend extremes.

RAVI
Indicator

RAVI

iMA

This indicator calculates the percentage deviation between two Simple Moving Averages and visualizes bullish or bearish momentum shifts based on price velocity exceeding predefined threshold boundaries.

ravi_base
Indicator

ravi_base

iMA

This indicator calculates the percentage difference between a short-term and a long-term Simple Moving Average to visualize momentum shifts.

RAVI_FX_Fisher2
Indicator

RAVI_FX_Fisher2

iATRiMA

This indicator quantifies market momentum by calculating the relative difference between a fast and slow linear weighted moving average, normalized by the average true range and optionally processed through an Inverse Fisher Transform.

RAVI_v1
Indicator

RAVI_v1

iMA

This indicator quantifies the percentage deviation between two Simple Moving Averages of different timeframes to identify trend momentum and price strength.

Ravi_v2
Indicator

Ravi_v2

iMA

This indicator quantifies the percentage divergence between a short-term and a long-term Simple Moving Average to identify momentum shifts.

RAVI_v3
Indicator

RAVI_v3

iMA

This indicator quantifies the percentage deviation between a fast simple moving average and a slow simple moving average to measure momentum shifts.

RCFMA
Indicator

RCFMA

iMA

This indicator quantifies market momentum by calculating the spread between medium and long-term moving averages while tracking the instantaneous rate of change for short-term price velocity.

RD-Combo
Indicator

RD-Combo

iCCIiADXiMAiRVI

This indicator generates trading signals by aggregating a weighted score from five distinct technical dimensions: moving average momentum, CCI oscillators, predictive regression forecasting, RVI trend strength, and ADX directional volume.

RD-Combo_v1
Indicator

RD-Combo_v1

iCCIiADXiMAiRVI

A sophisticated trend-following system that aggregates price momentum, moving average crossovers, ADX strength, CCI oscillations, and regression-based forecast oscillators into a unified signal.

RD-Combo_v2
Indicator

RD-Combo_v2

iCCIiADXiMAiRVI

A multi-factor momentum engine that synthesizes smoothed moving averages, CCI, RVI, ADX strength, and a polynomial forecast oscillator to identify high-probability trend entries.

RD-Combo_v3
Indicator

RD-Combo_v3

iCCIiADXiMAiRVI

This indicator synthesizes momentum, trend velocity, and predictive regression analysis into a unified signal by aggregating data from Moving Averages, CCI, RVI, ADX, and a custom forecast oscillator.

RD-Combo_v5
Indicator

RD-Combo_v5

iCCIiADXiMAiRVI

This indicator aggregates momentum, trend, and volatility oscillators—specifically LWMA crossovers, CCI dynamics, RVI signal deviations, and ADX strength—into a unified consensus scoring system to identify high-probability trend entries.

realMACD
Indicator

realMACD

iMA

This indicator quantifies the velocity of price movement by calculating the divergence between two exponential moving averages and overlaying a smoothed signal line to identify momentum shifts.

Real_Time_MultiIndicator_v1
Indicator

Real_Time_MultiIndicator_v1

iMACDiADXiMAiSAR

This indicator aggregates signal data from Parabolic SAR, MACD, Moving Average crossovers, and ADX across multiple timeframes into a synchronized visual dashboard.

Real_Woodie_CCI
Indicator

Real_Woodie_CCI

iCCIiMA

This indicator synthesizes standard Commodity Channel Index calculations with an LSMA-based center line to visualize momentum shifts, price trends, and multi-stage state transitions through dynamic histogram coloring.

Regression_Channel
Indicator

Regression_Channel

iMA

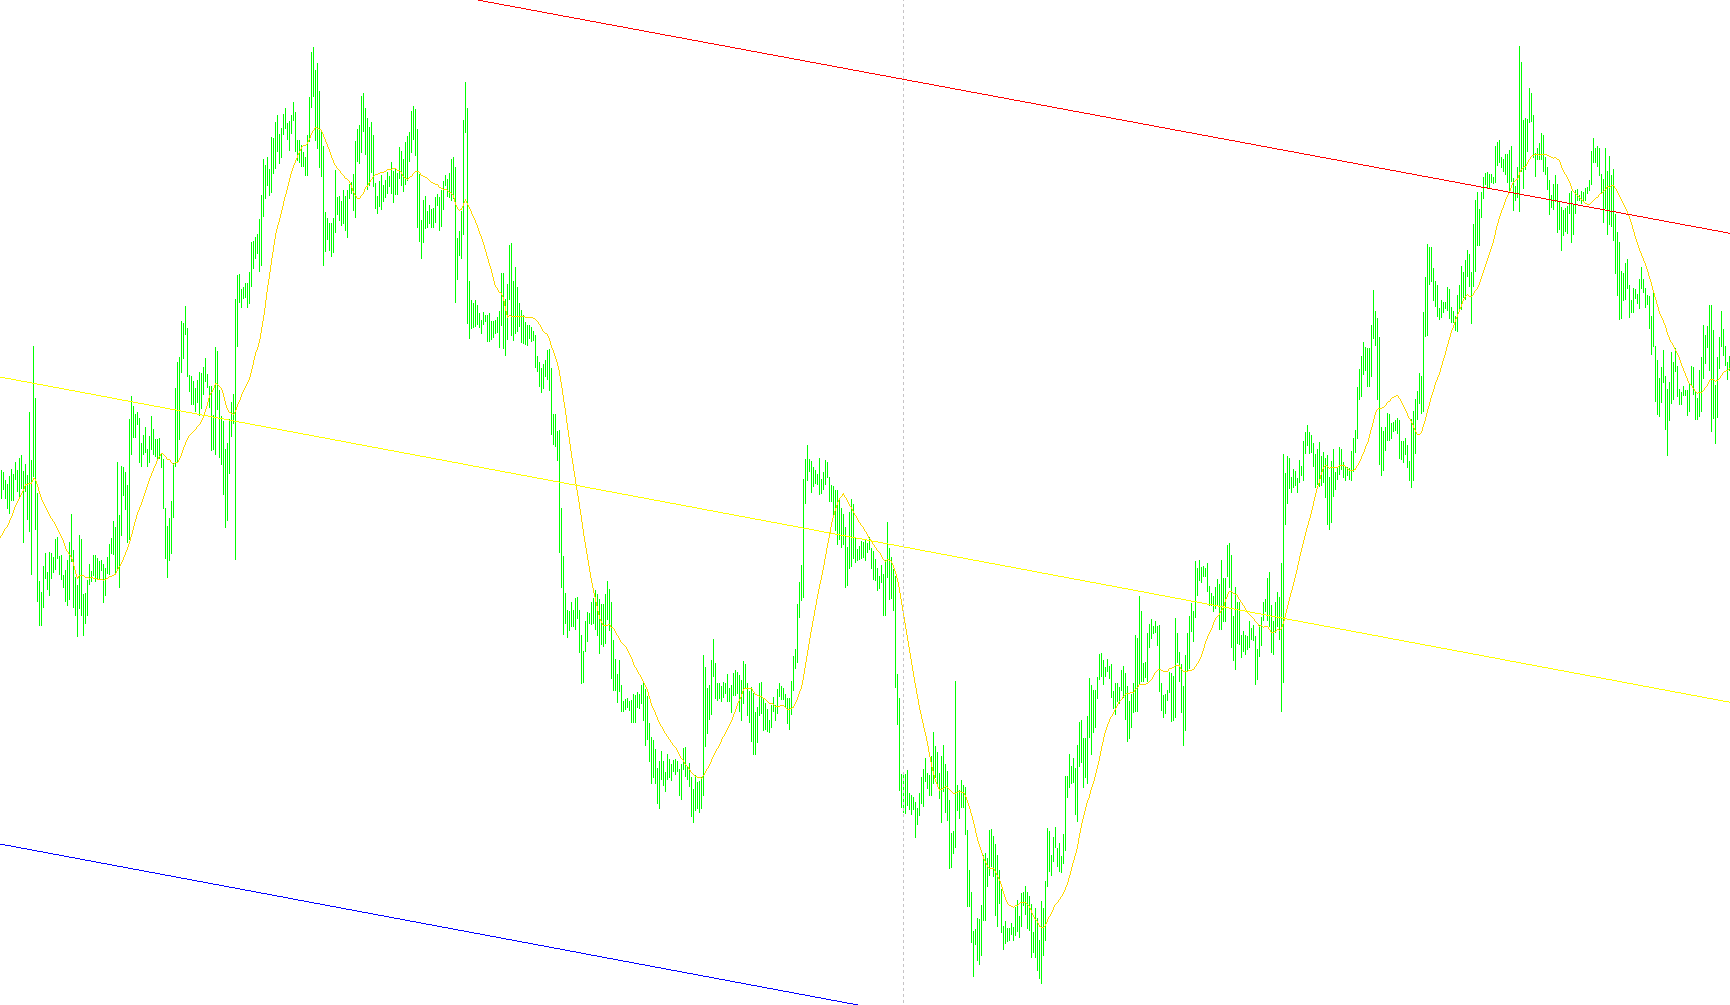
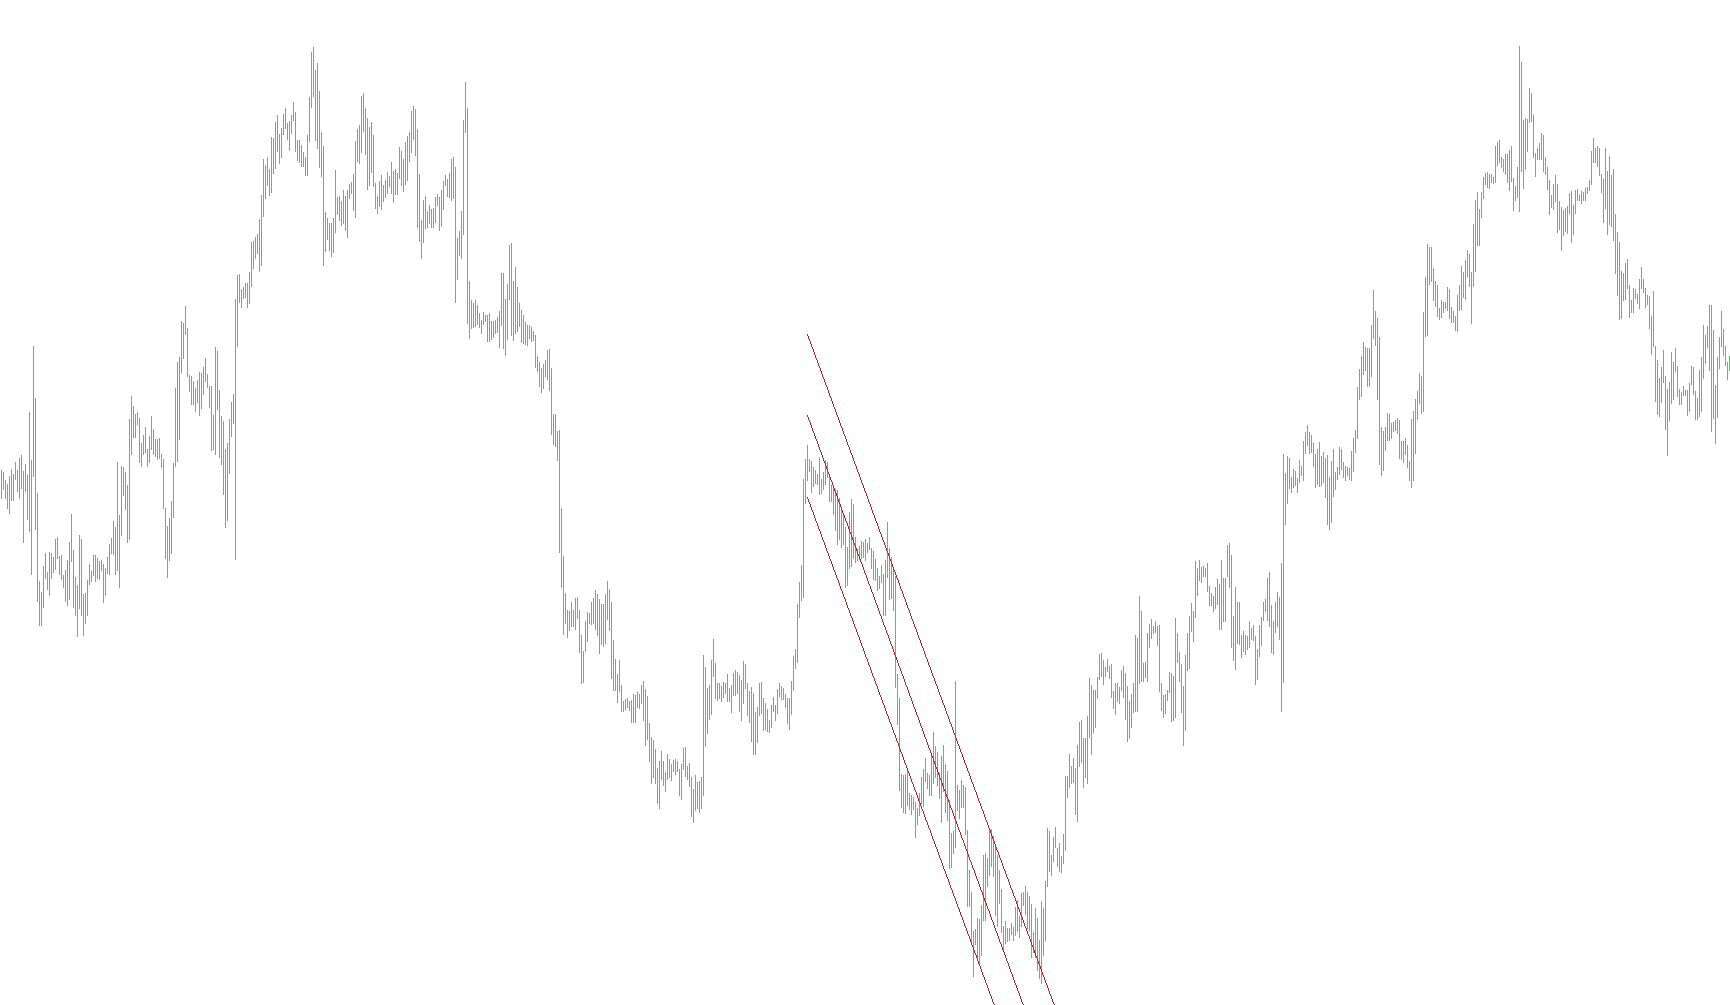
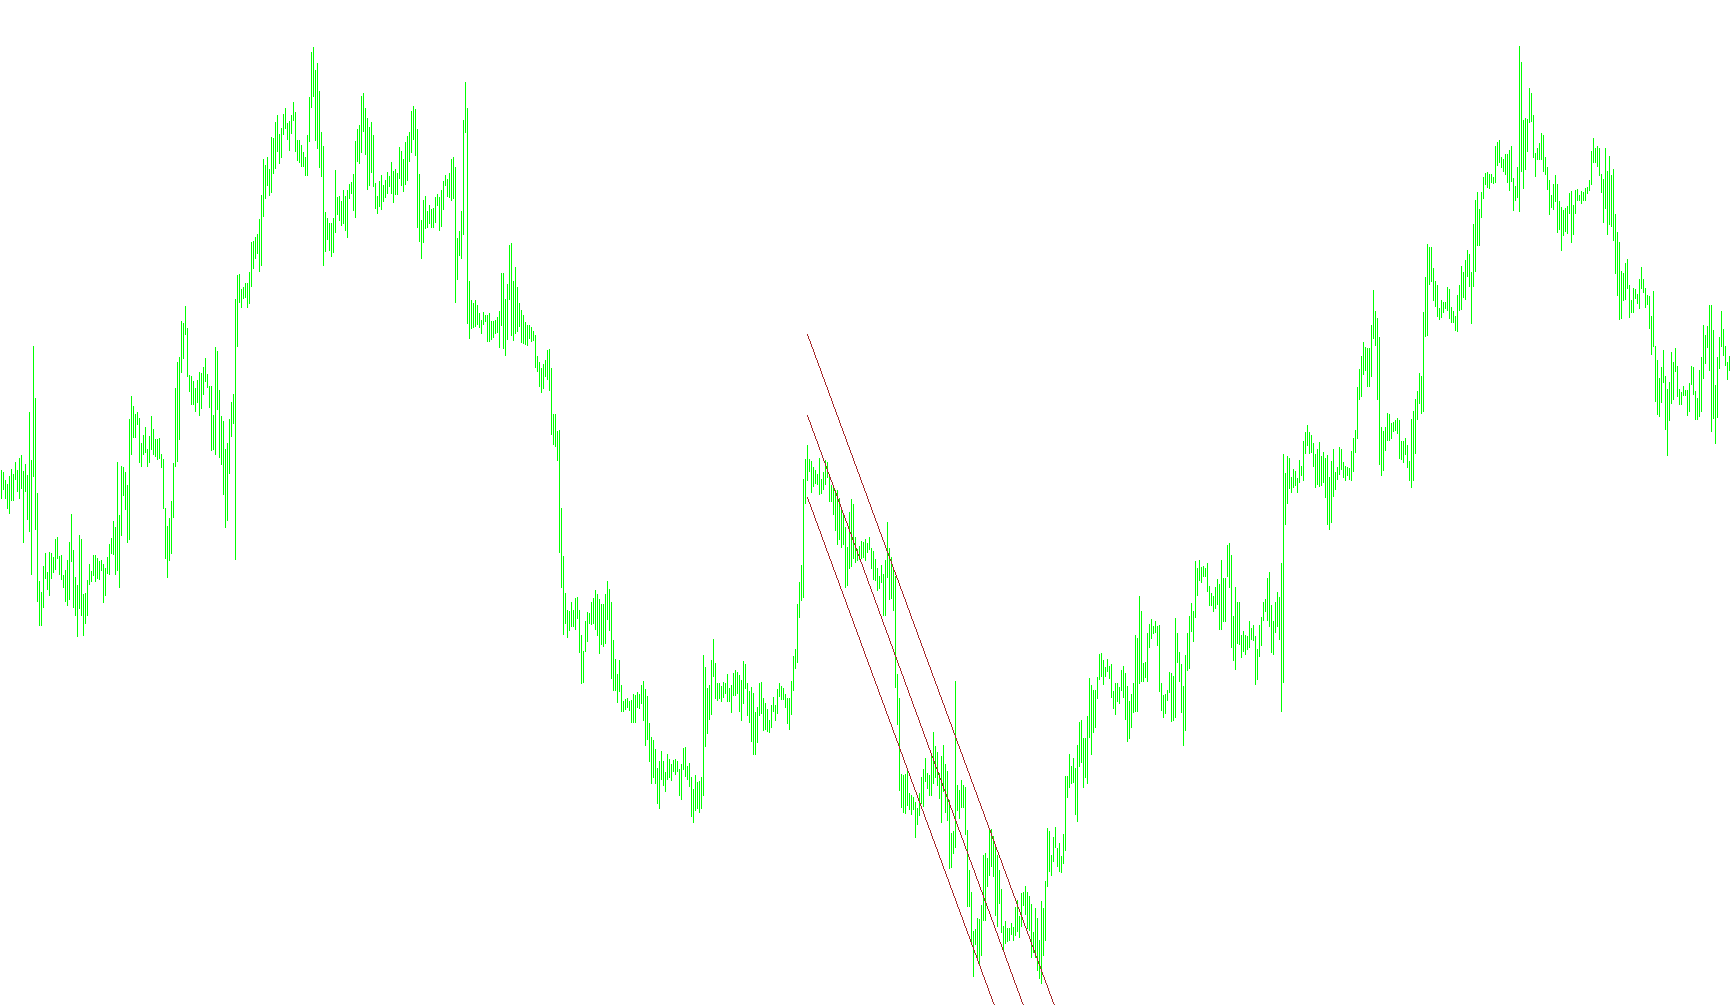
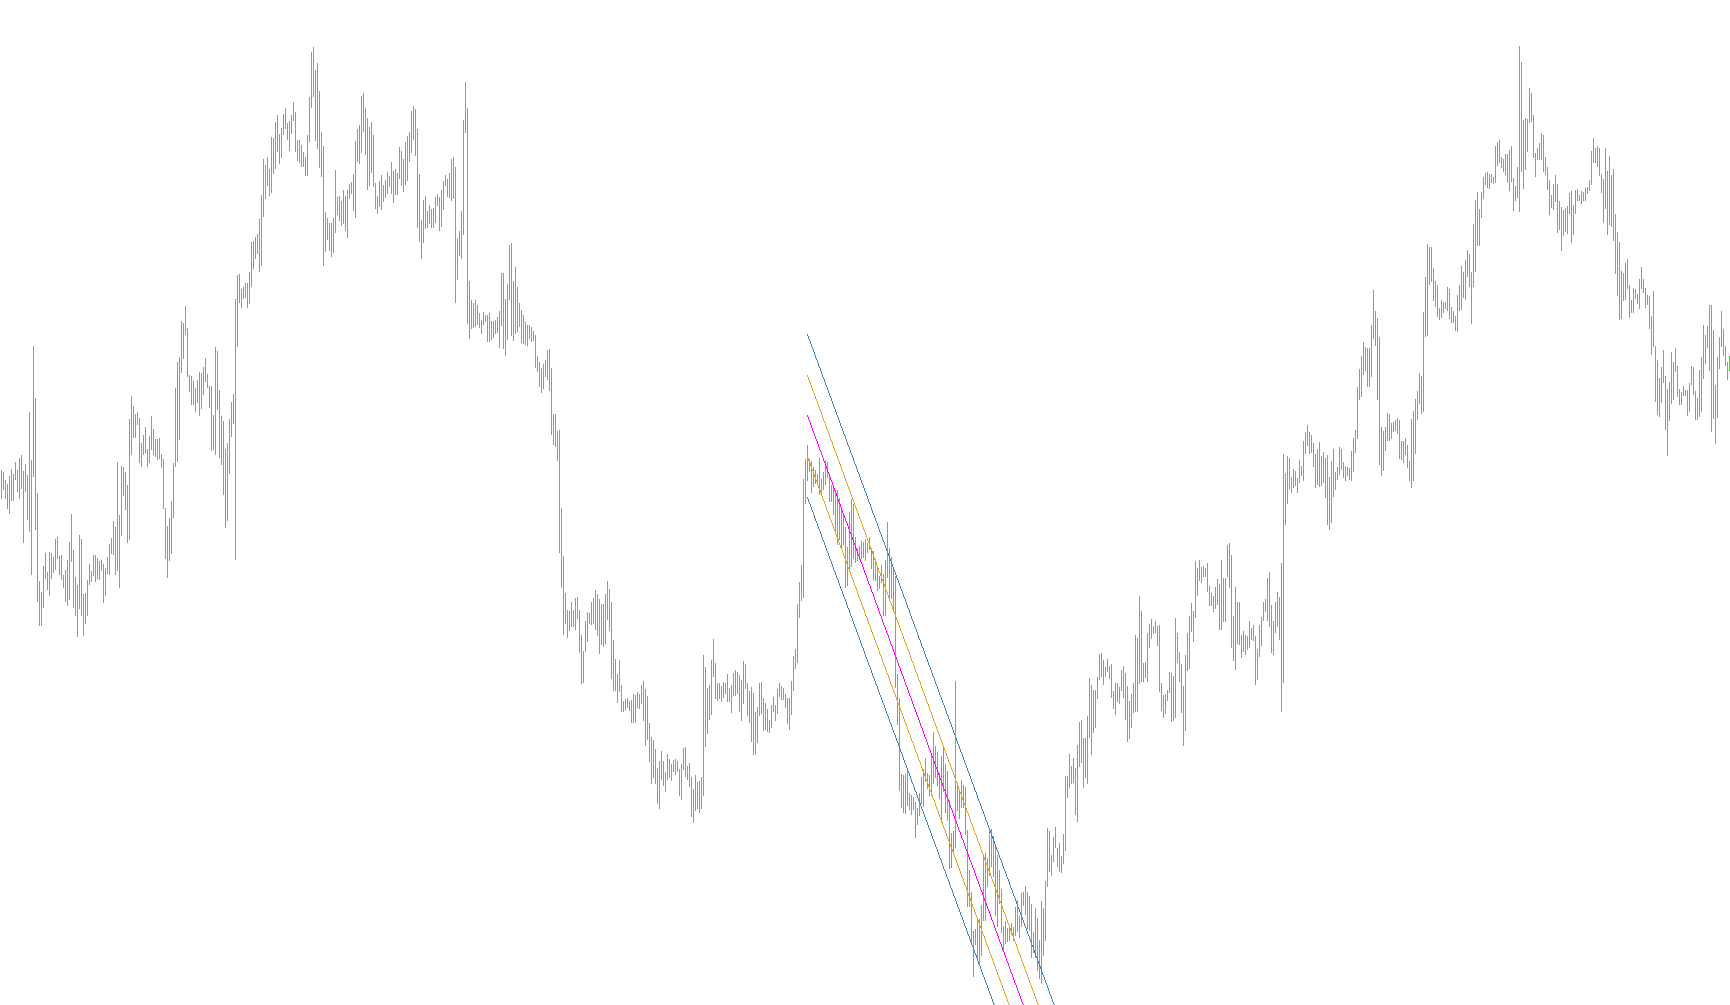
This indicator dynamically calculates a linear regression band by identifying significant price extremes and applying standard deviation offsets to determine volatility boundaries.

Regression_Channel
Indicator

Regression_Channel

iMA

This indicator automatically identifies significant price extremes relative to a moving average to construct a linear regression channel based on the standard deviation of price variance.

Regression_Channel_v1
Indicator

Regression_Channel_v1

iMA

This indicator automatically identifies structural pivot points relative to a moving average to construct a linear regression channel bounded by standard deviation offsets.

Regression_Channel_V2
Indicator

Regression_Channel_V2

iMA

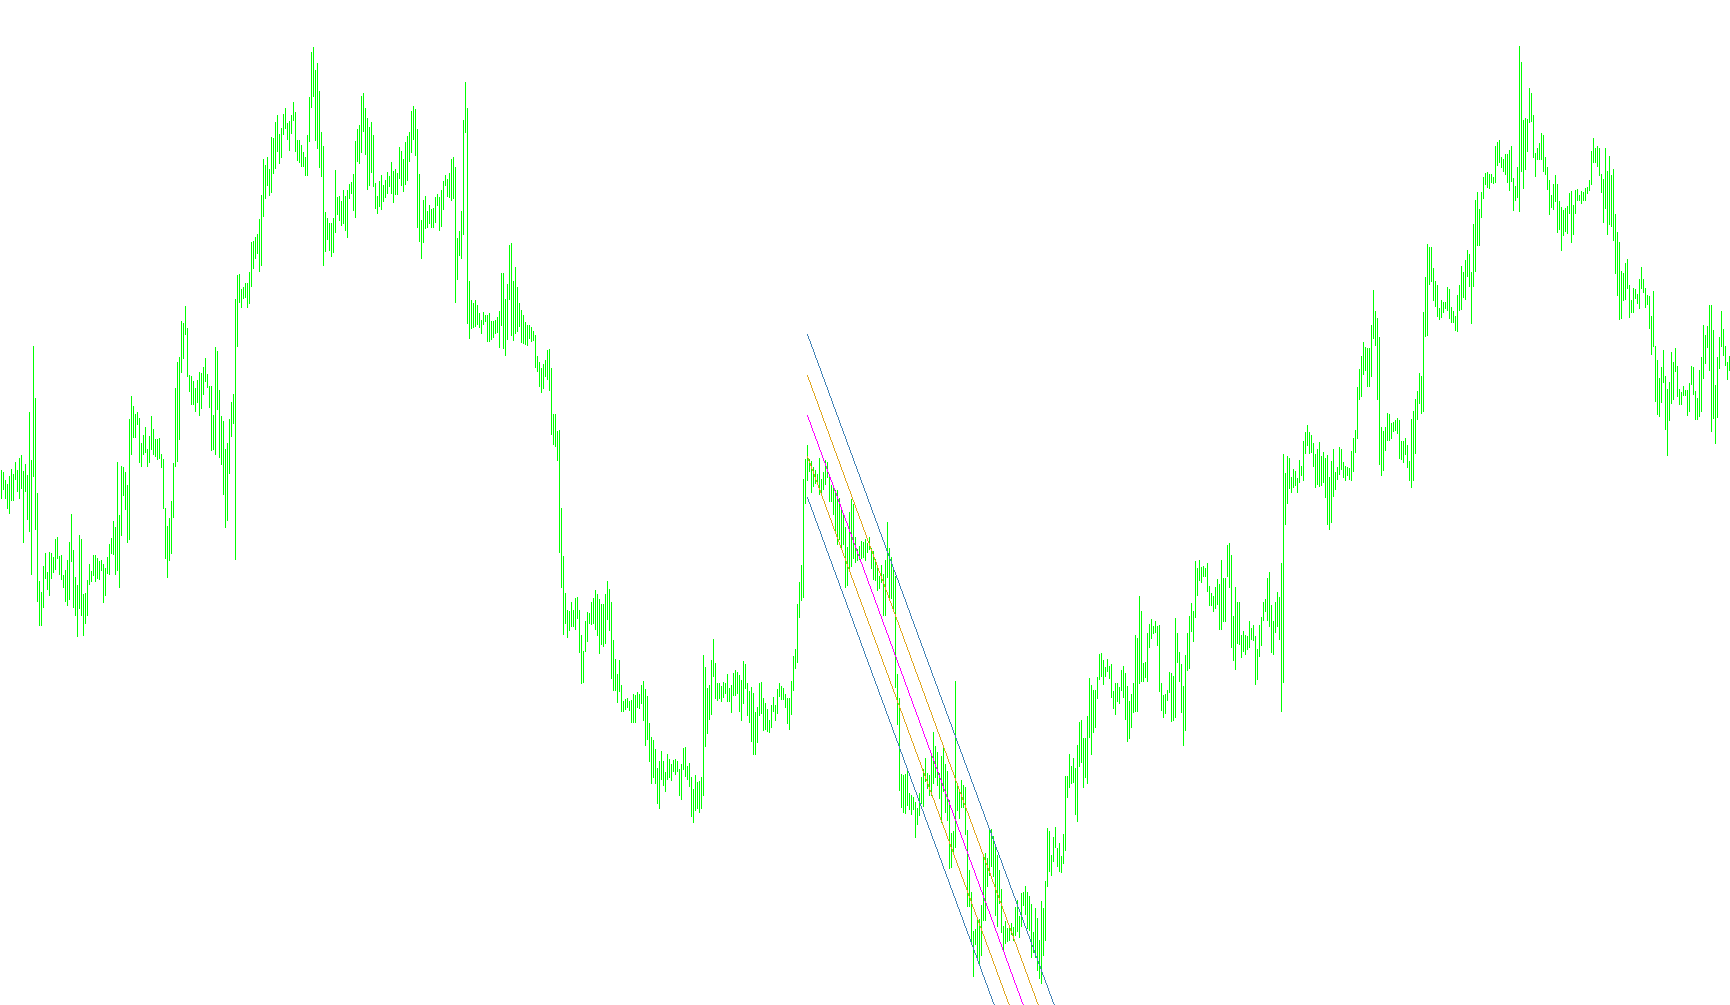
This indicator dynamically constructs a linear regression model based on extreme price excursions from a moving average to define volatility bands using multiple standard deviation thresholds.

Regression_Channel_V2_v1
Indicator

Regression_Channel_V2_v1

iMA

This indicator identifies price extremes by projecting a linear regression channel based on specific moving average crossovers, utilizing dual standard deviation boundaries to define inner and outer volatility zones.

Regression_Channel_V2_v2
Indicator

Regression_Channel_V2_v2

iMA

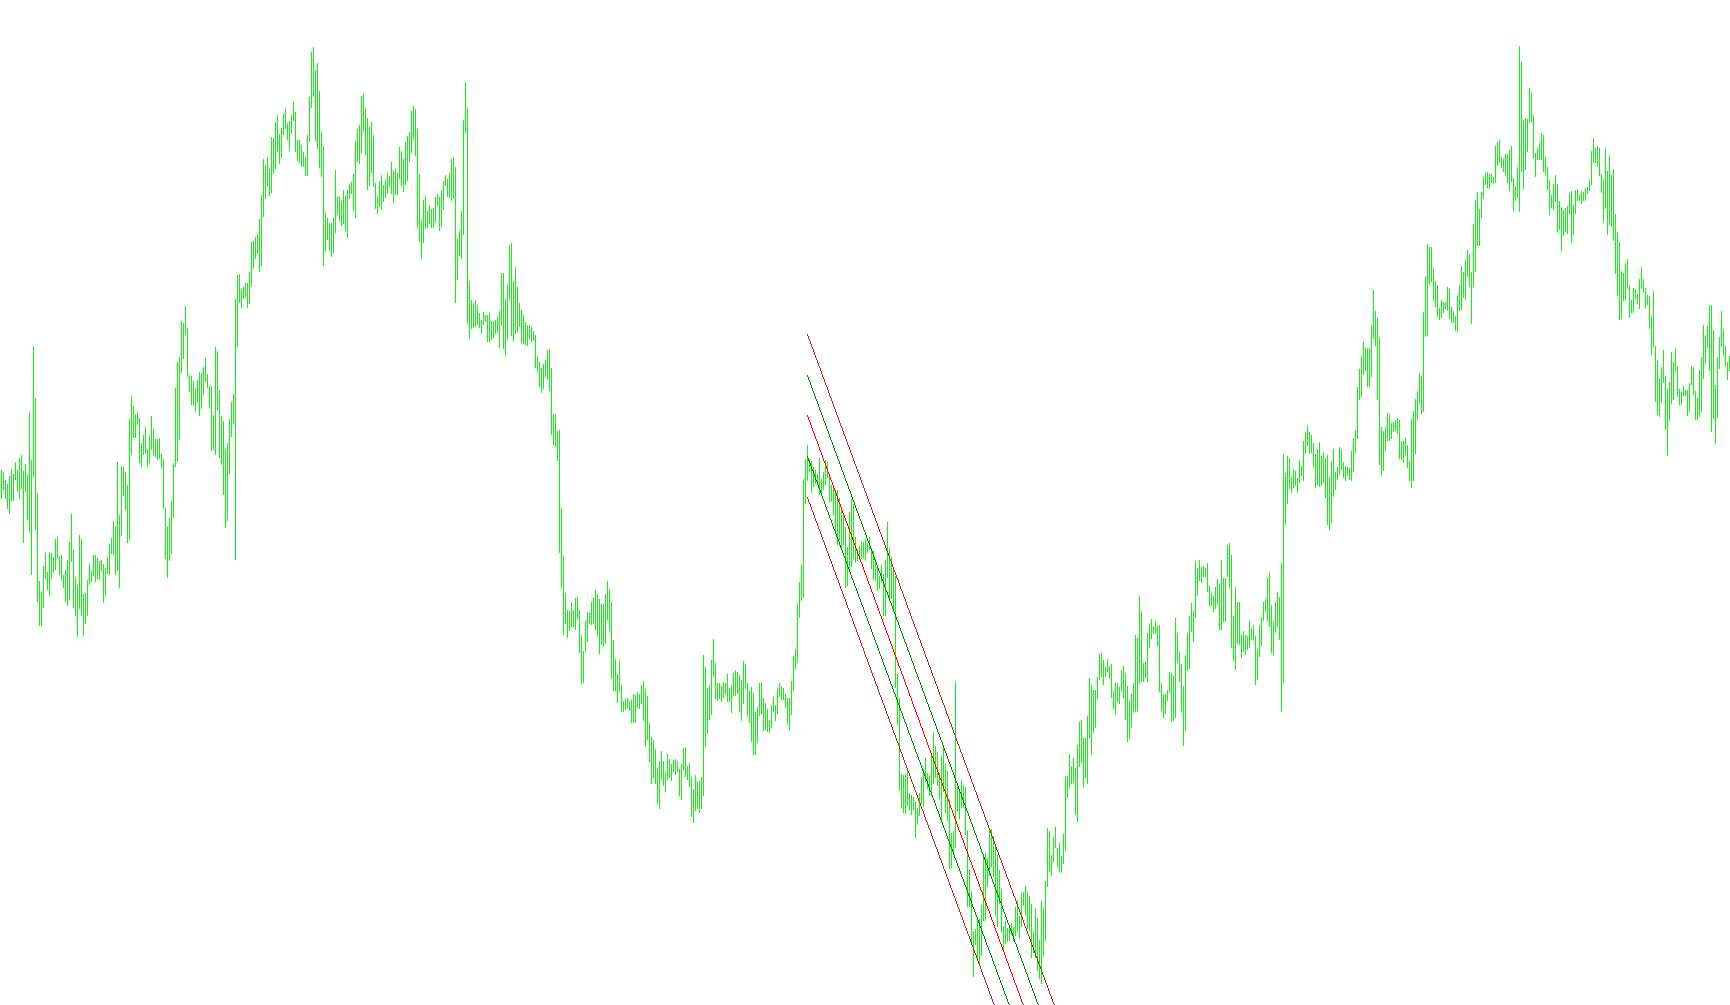
This indicator dynamically calculates a linear regression channel by identifying price extremes relative to a moving average and projecting multiple volatility bands using dual standard deviation coefficients.

Regression_Channel_V2_v3
Indicator

Regression_Channel_V2_v3

iMA

This indicator calculates a linear regression line based on price extremes to establish a multi-layered volatility corridor using dual standard deviation bands.