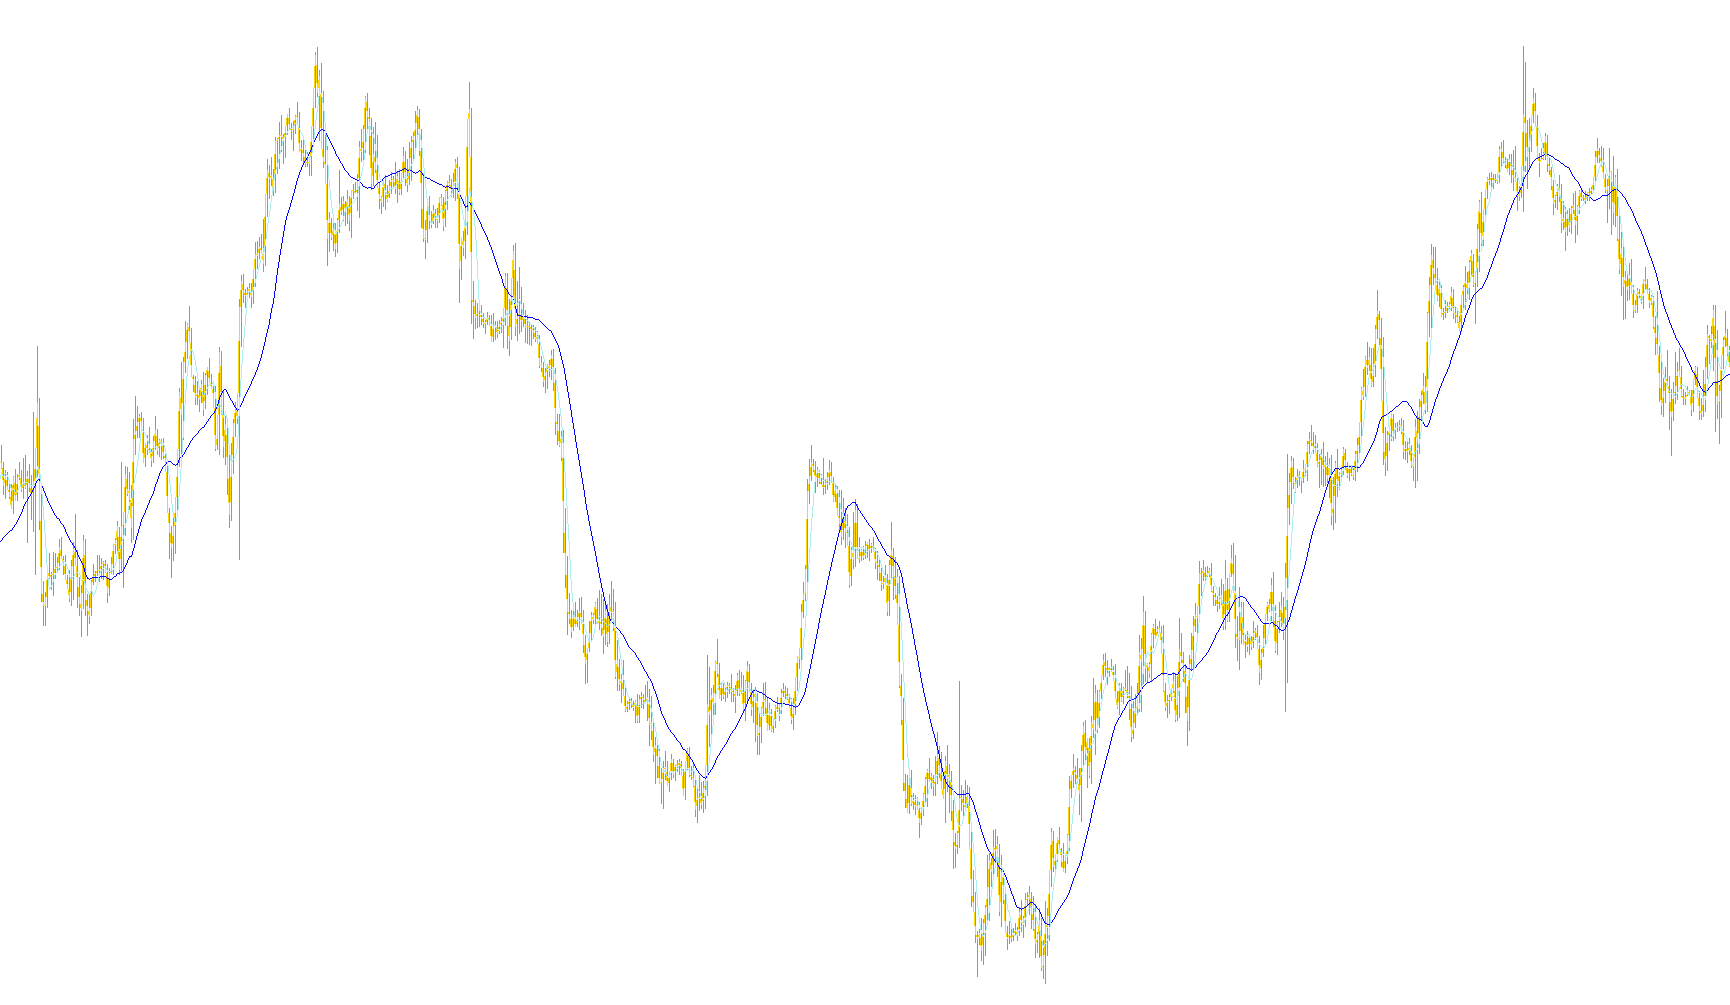
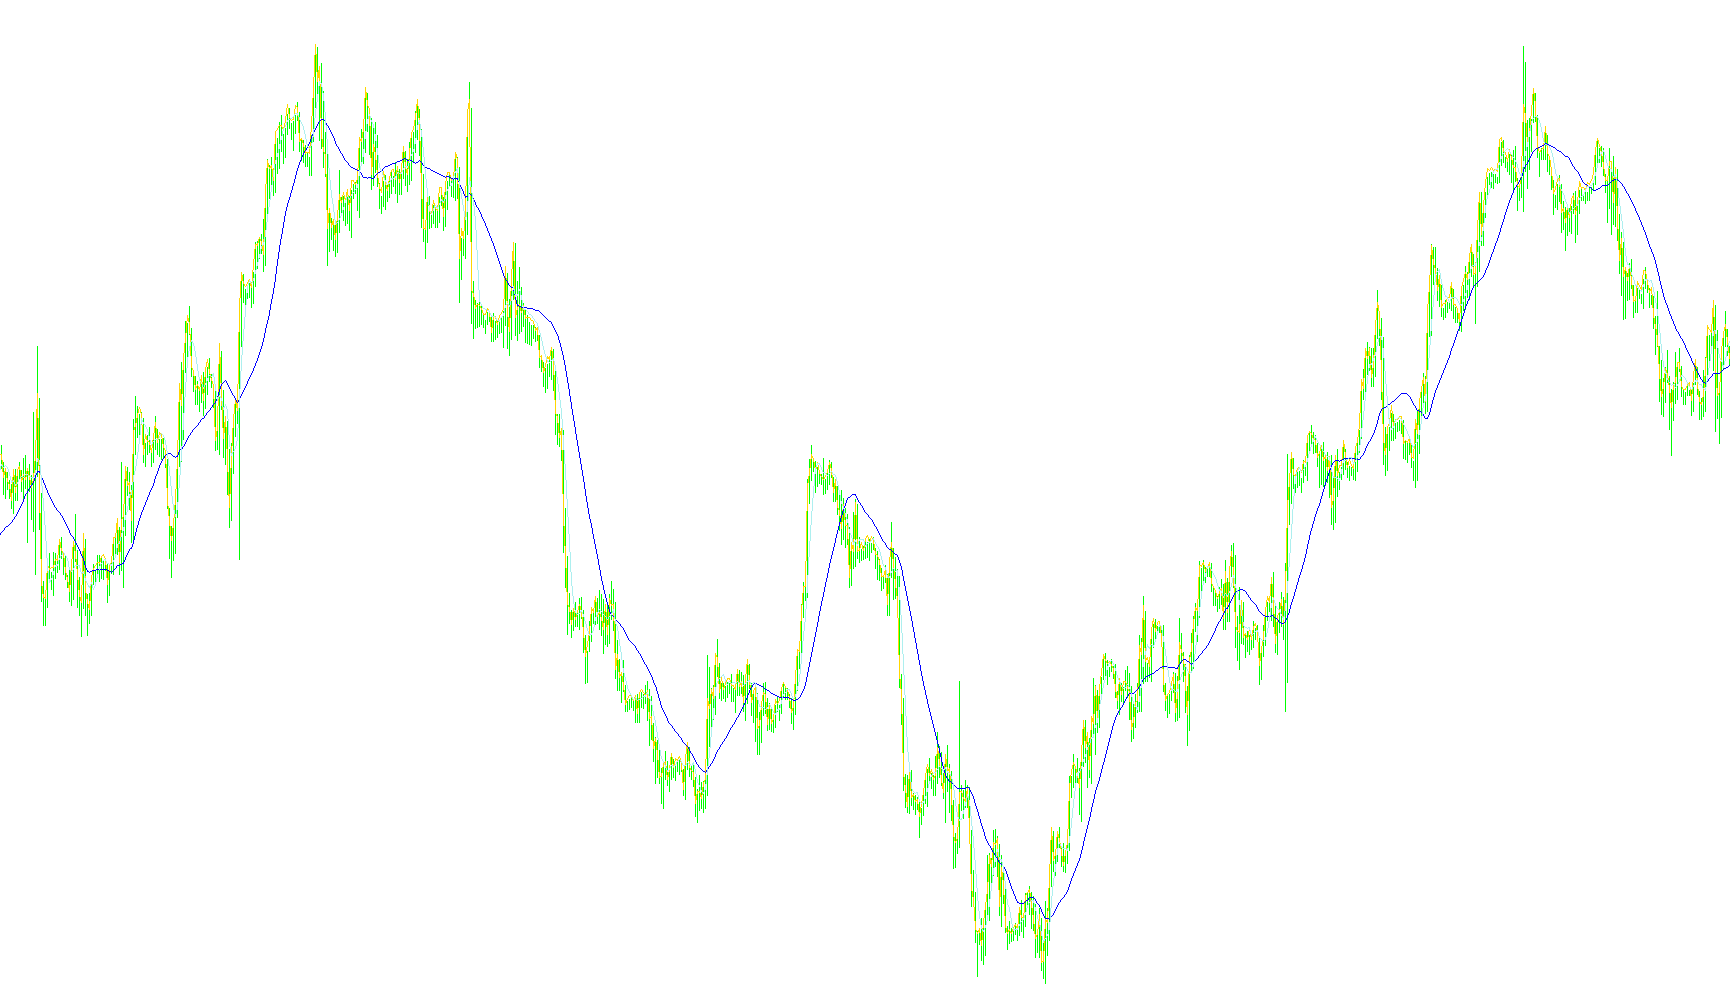
PriceInfo2_1
Indicator

PriceInfo2_1

iMA

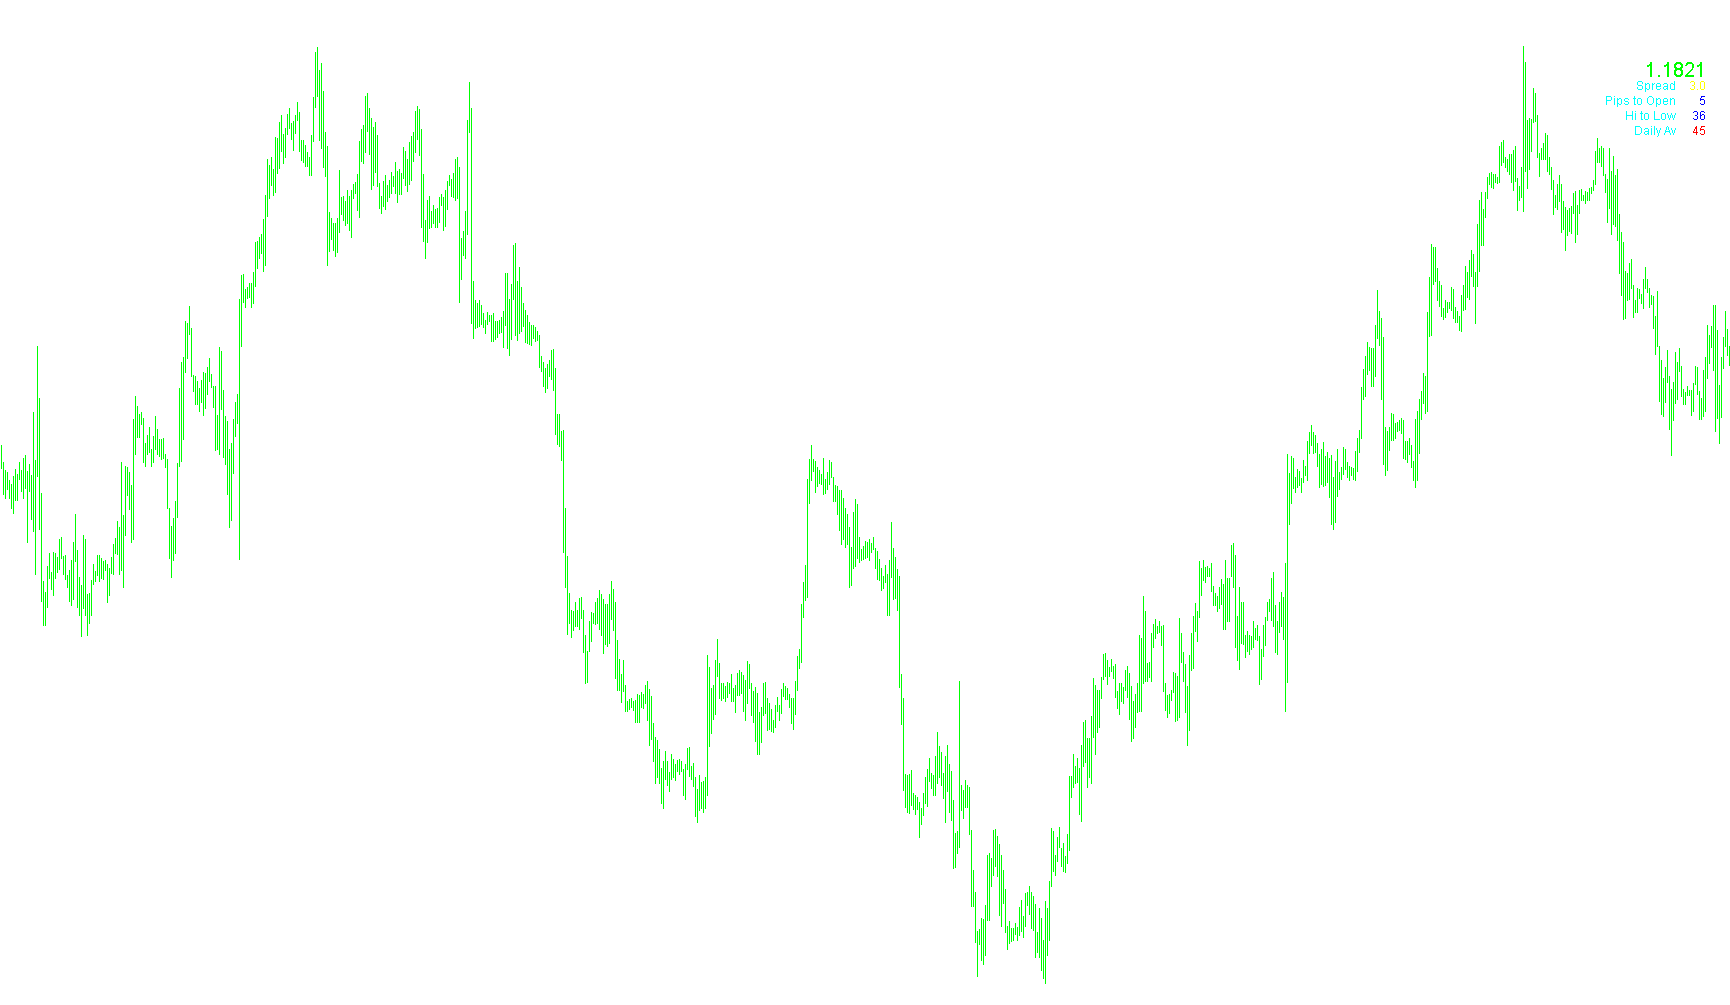
This indicator projects a real-time multi-metric overlay that calculates daily price excursions, average volatility benchmarks, and live spread tracking to visualize market range dynamics.
pricepercentrange
Indicator

pricepercentrange

iMAiMAOnArray

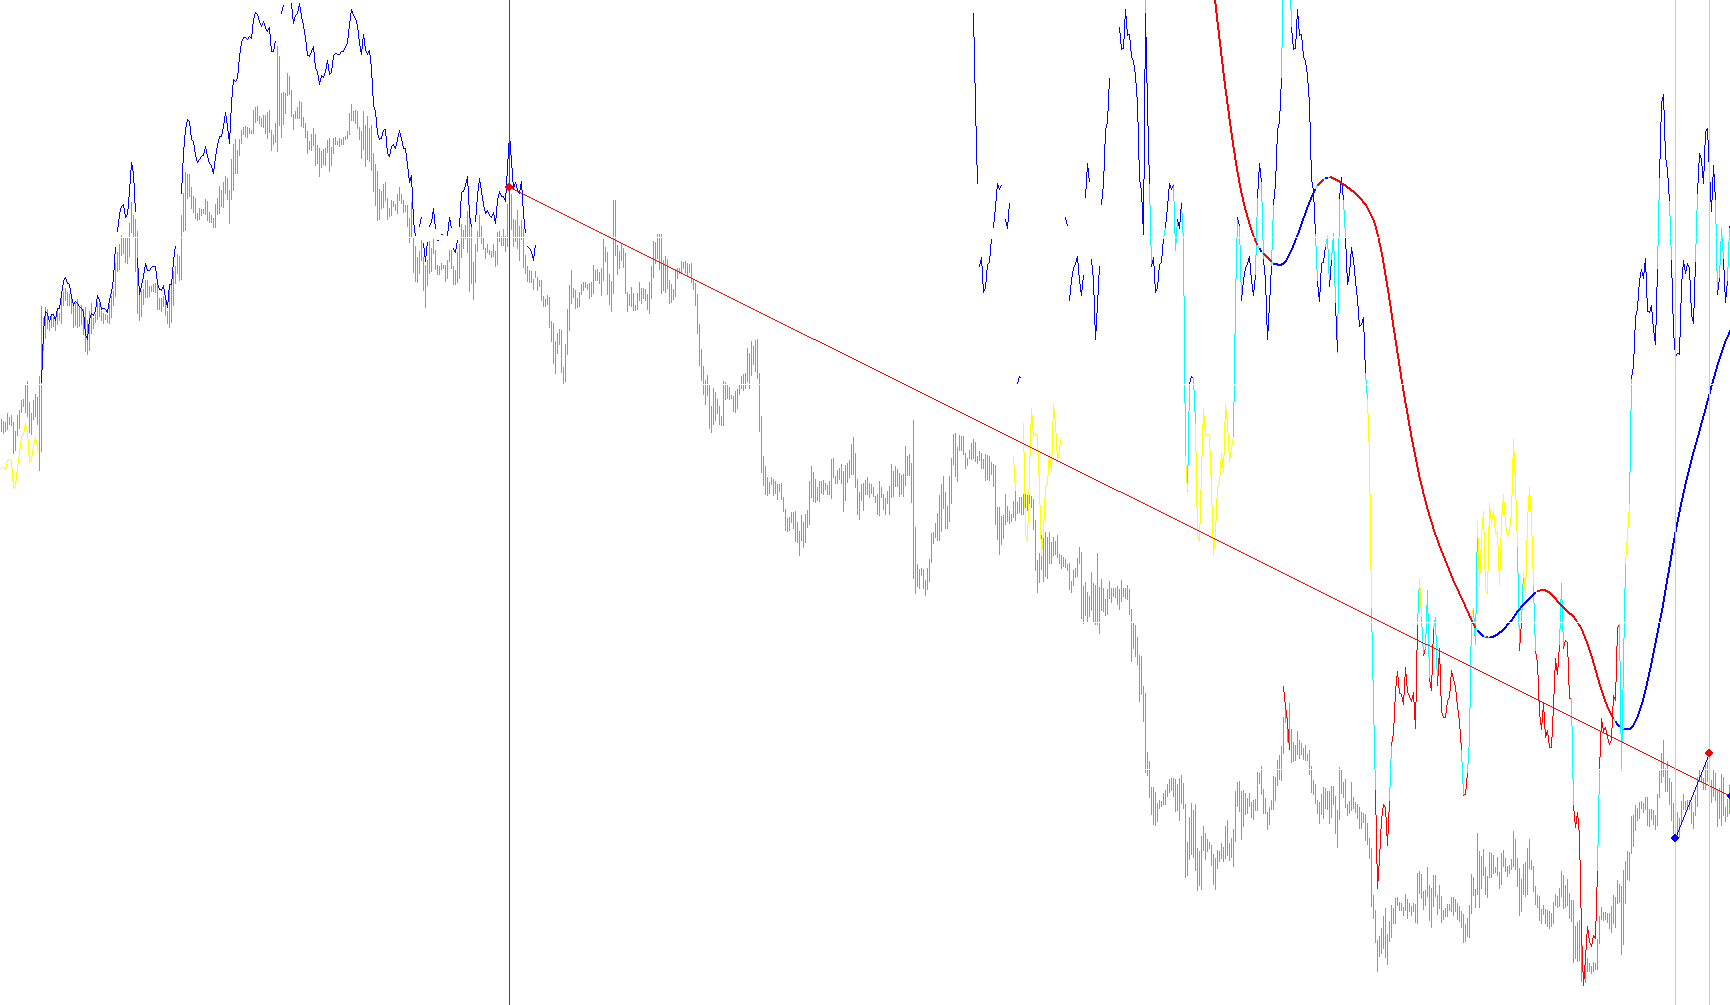
This indicator quantifies price relative position within a 100-bar volatility window and identifies structural trend shifts by synthesizing Fibonacci retracement levels with nested moving average dynamics.

PricePosition
Indicator

PricePosition

iMA

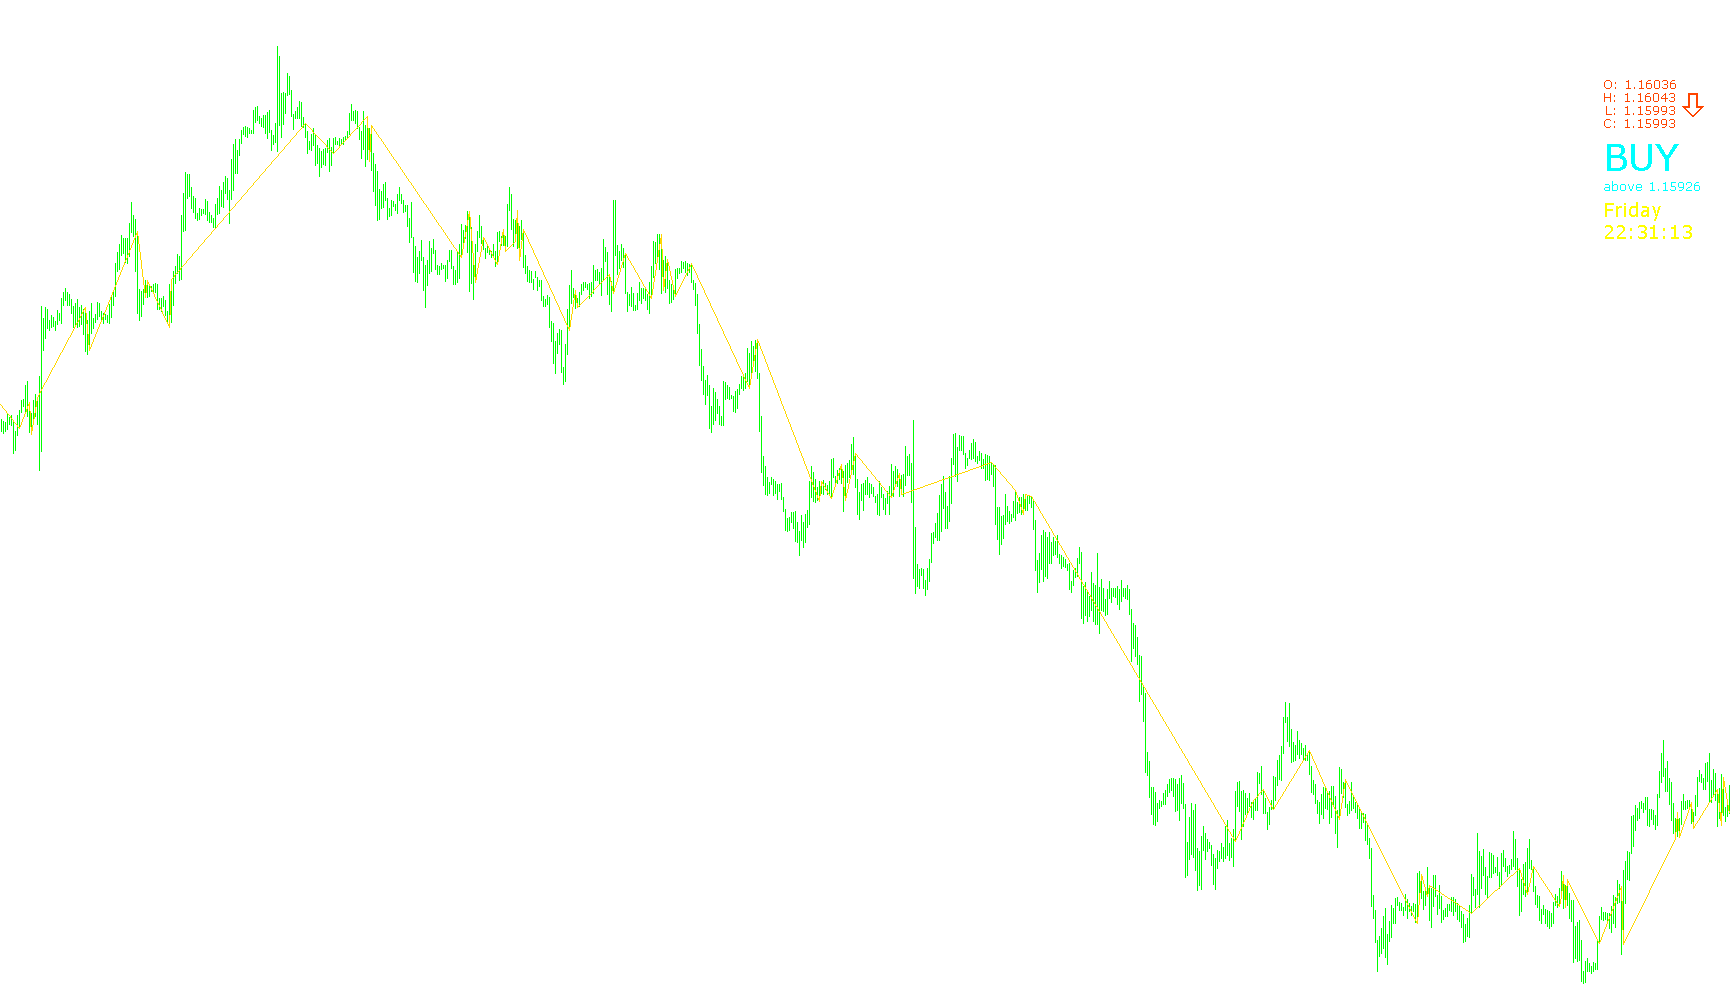
This indicator identifies dynamic price pivot points by calculating the intersection of smoothed moving averages to determine bullish or bearish structural transitions.

PriceTrend
Indicator

PriceTrend

iMA

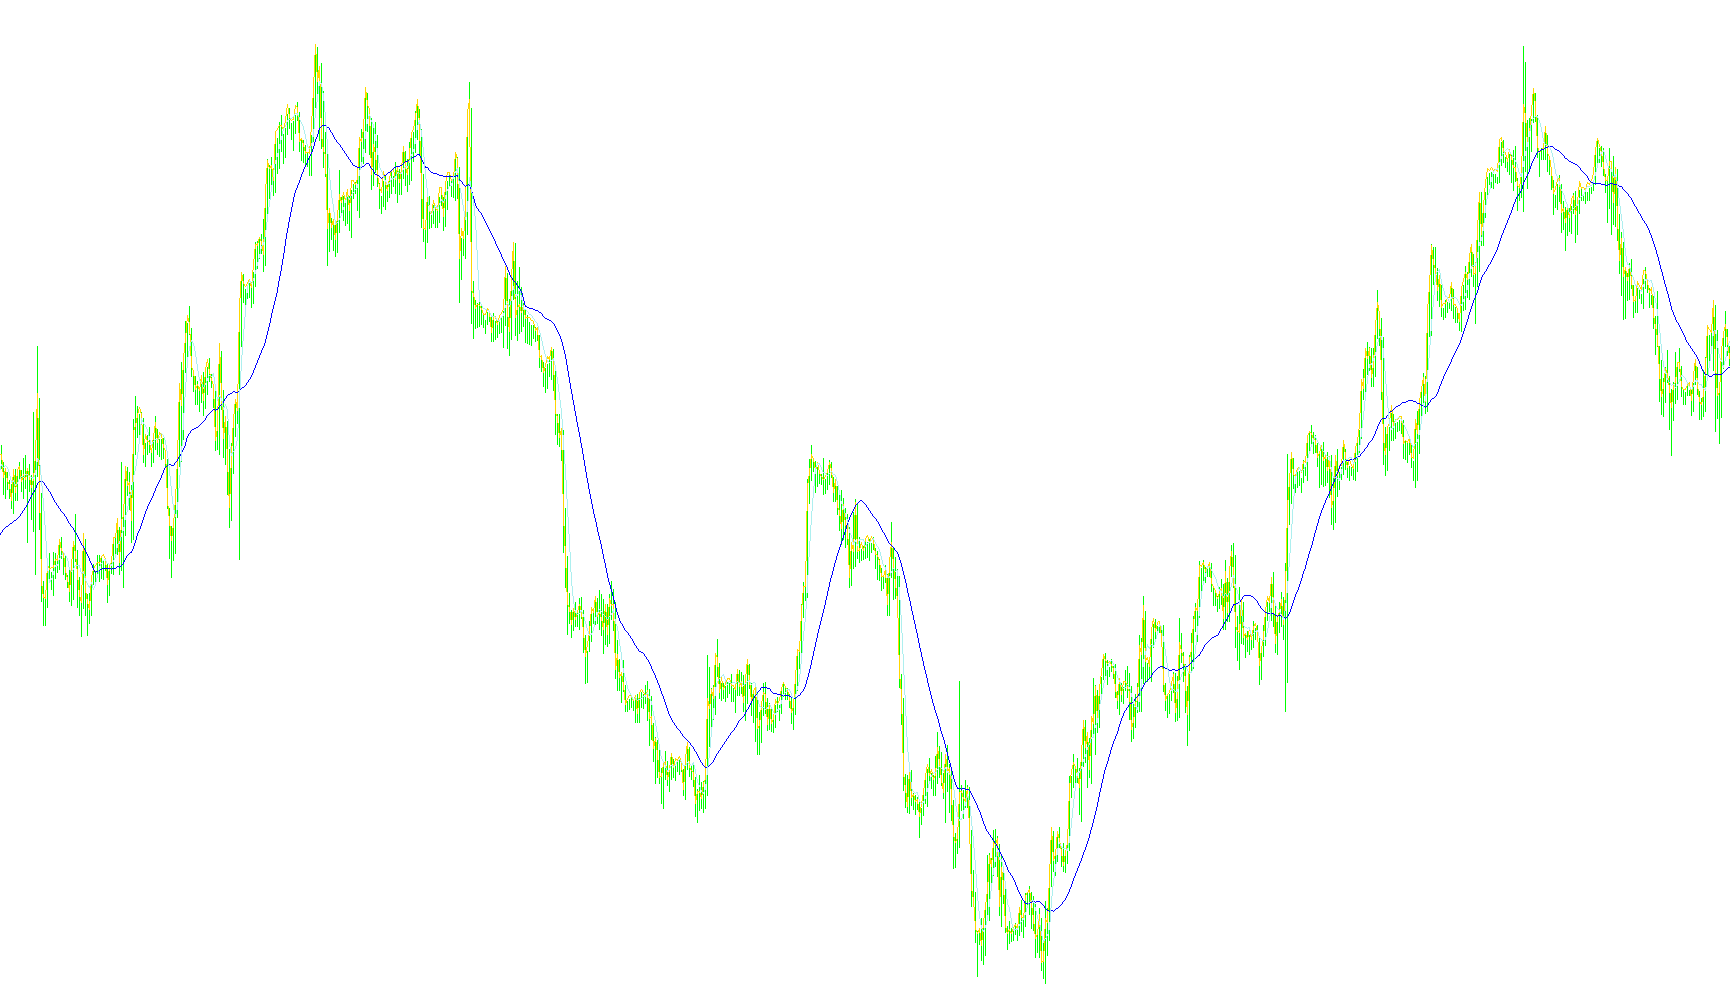
This indicator synthesizes multi-timeframe price actions with dual moving average crossovers to visualize structural momentum shifts.

PriceTrend1
Indicator

PriceTrend1

iMA

This indicator identifies multi-layered market direction by analyzing the relative positioning of price action against two distinct moving average hierarchies to signal primary and secondary trend shifts.

PriceTrend1A
Indicator

PriceTrend1A

iMA

This indicator analyzes market sentiment by comparing multi-timeframe price action against two distinct moving average layers to identify primary and secondary trend shifts.

PriceTrend1x2
Indicator

PriceTrend1x2

iMA

This indicator analyzes price action across three distinct timeframes using nested moving averages to identify synchronized bullish or bearish trend shifts.

PriceTrend1_001
Indicator

PriceTrend1_001

iMA

This indicator identifies directional bias by analyzing the relative positioning of price action against two distinct moving average layers to distinguish between primary trends and micro-fluctuations.

PriceTrender
Indicator

PriceTrender

iMA

This indicator maps smoothed moving average dynamics from a higher timeframe onto the current chart using dynamic price point selection.

PriceTrender2
Indicator

PriceTrender2

iMA

This indicator synchronizes multi-timeframe price action with dual moving average smoothing to visualize momentum shifts across varying temporalities.

PriceTrender2Alert
Indicator

PriceTrender2Alert

iMA

This indicator detects dynamic crossovers between customizable moving averages and specific price points across higher timeframes to trigger real-time alerts.

PriceTrender2KbarShift_cw
Indicator

PriceTrender2KbarShift_cw

iMA

This indicator synthesizes higher timeframe price data and dual moving average smoothing to visualize structural trends across different temporal scales.

PriceTrender2KbarShift_sw
Indicator

PriceTrender2KbarShift_sw

iMA

This indicator synchronizes price action and dual moving average crossovers across higher timeframes to visualize structural momentum.

PriceTrender2KbarShift_sw_v1
Indicator

PriceTrender2KbarShift_sw_v1

iMA

This indicator synchronizes multi-timeframe price data with dual moving average filters to visualize overarching trend dynamics across disparate temporalities.

PriceTrender2_v1
Indicator

PriceTrender2_v1

iMA
PriceTrenderChartTest
Indicator

PriceTrenderChartTest

iMA

This indicator identifies trend reversals by monitoring the crossover of a customizable price point against a Simple Moving Average across synchronized higher timeframes.

PriceTrend_001
Indicator

PriceTrend_001

iMA

This indicator projects multi-timeframe price action and dual moving average convergence onto a synchronized sub-window to visualize trend dynamics across disparate temporalities.

Priliv
Indicator

Priliv

iMA

This indicator projects trend momentum by calculating the rate of change between weighted moving averages across current, adjacent, and subsequent higher timeframes.

Priliv_001
Indicator

Priliv_001

iMA

This indicator calculates the variance between current and offset Linear Weighted Moving Averages across multiple timeframes to identify momentum shifts.

Priliv_s
Indicator

Priliv_s

iMA

This indicator calculates the momentum velocity of trends across three distinct temporal horizons by measuring the delta between linear weighted moving averages at varying historical offsets.

Priliv_sw
Indicator

Priliv_sw

iMA

This indicator calculates and visualizes trend velocity across multiple temporal scales by measuring the differential shift of Linear Weighted Moving Averages.

Priliv_s_v1
Indicator

Priliv_s_v1

iMA

This indicator calculates and visualizes trend velocity across multiple timeframes by measuring the differential displacement of linear weighted moving averages.

Indicator

Priliv_v1

iMA
Indicator

Priliv_v2

iMA
pro
Indicator

pro

iMAiMAOnArray

This indicator quantifies the percentage difference between fast and slow exponential moving averages to identify momentum shifts and crossover signals.

Indicator

ProbMeter_v1.1

iCCIiMACDiADXiMA
Indicator

PVD$FL

iMA
PVT_v1
Indicator

PVT_v1

iMA

The logic quantifies market velocity by integrating the relative percentage change of price movement weighted by the current trading volume.

pwo_svs
Indicator

pwo_svs

iMA

This indicator synthesizes multiple moving average variances and differential offsets into a four-layered histogram to visualize complex price momentum shifts.

p_FanSimple8_for_me
Indicator

p_FanSimple8_for_me

iMA

This indicator synchronizes price action and moving average sequences across multiple concurrent timeframes to visualize trend confluence and directional bias.

QEMA
Indicator

QEMA

iMAiMAOnArray

This indicator calculates a specialized smoothing curve by applying a quintuple recursive exponential moving average sequence and synthesizing them through a weighted polynomial coefficients formula.

QuickMA
Indicator

QuickMA

iMA

This indicator computes a dynamic moving average by applying a linear triangular weighting distribution to price data, prioritizing central values to smooth volatility while maintaining responsiveness.

R-Squared_v1
Indicator

R-Squared_v1

iMA

Quantifies the strength of linear price trends by calculating the coefficient of determination over a rolling moving average period.

R-Squared_v11
Indicator

R-Squared_v11

iMA

This indicator quantifies the linear correlation between price movements and time intervals to assess trend linearity and consistency through smoothed regression analysis.

R2_Arrows
Indicator

R2_Arrows

iMAiRSI

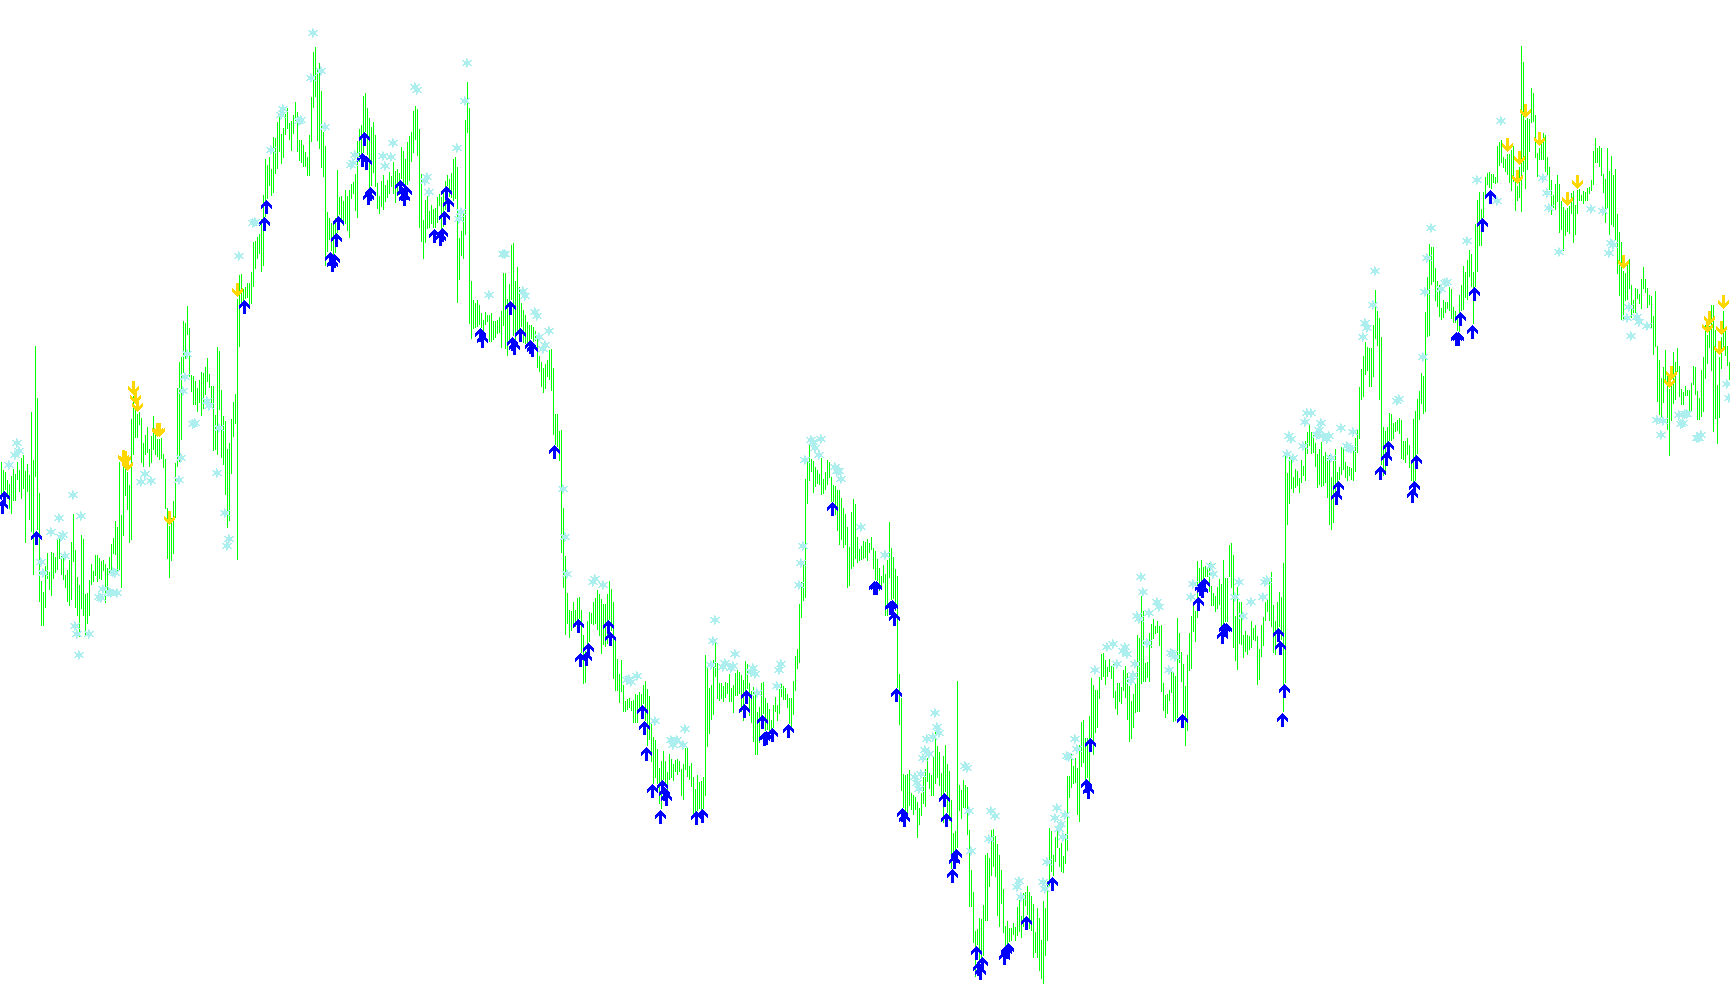
This indicator identifies directional reversals by synchronizing daily SMA trend filtering with multi-day RSI momentum acceleration and exhaustion thresholds.

R2_ArrowsV1
Indicator

R2_ArrowsV1

iMAiRSI

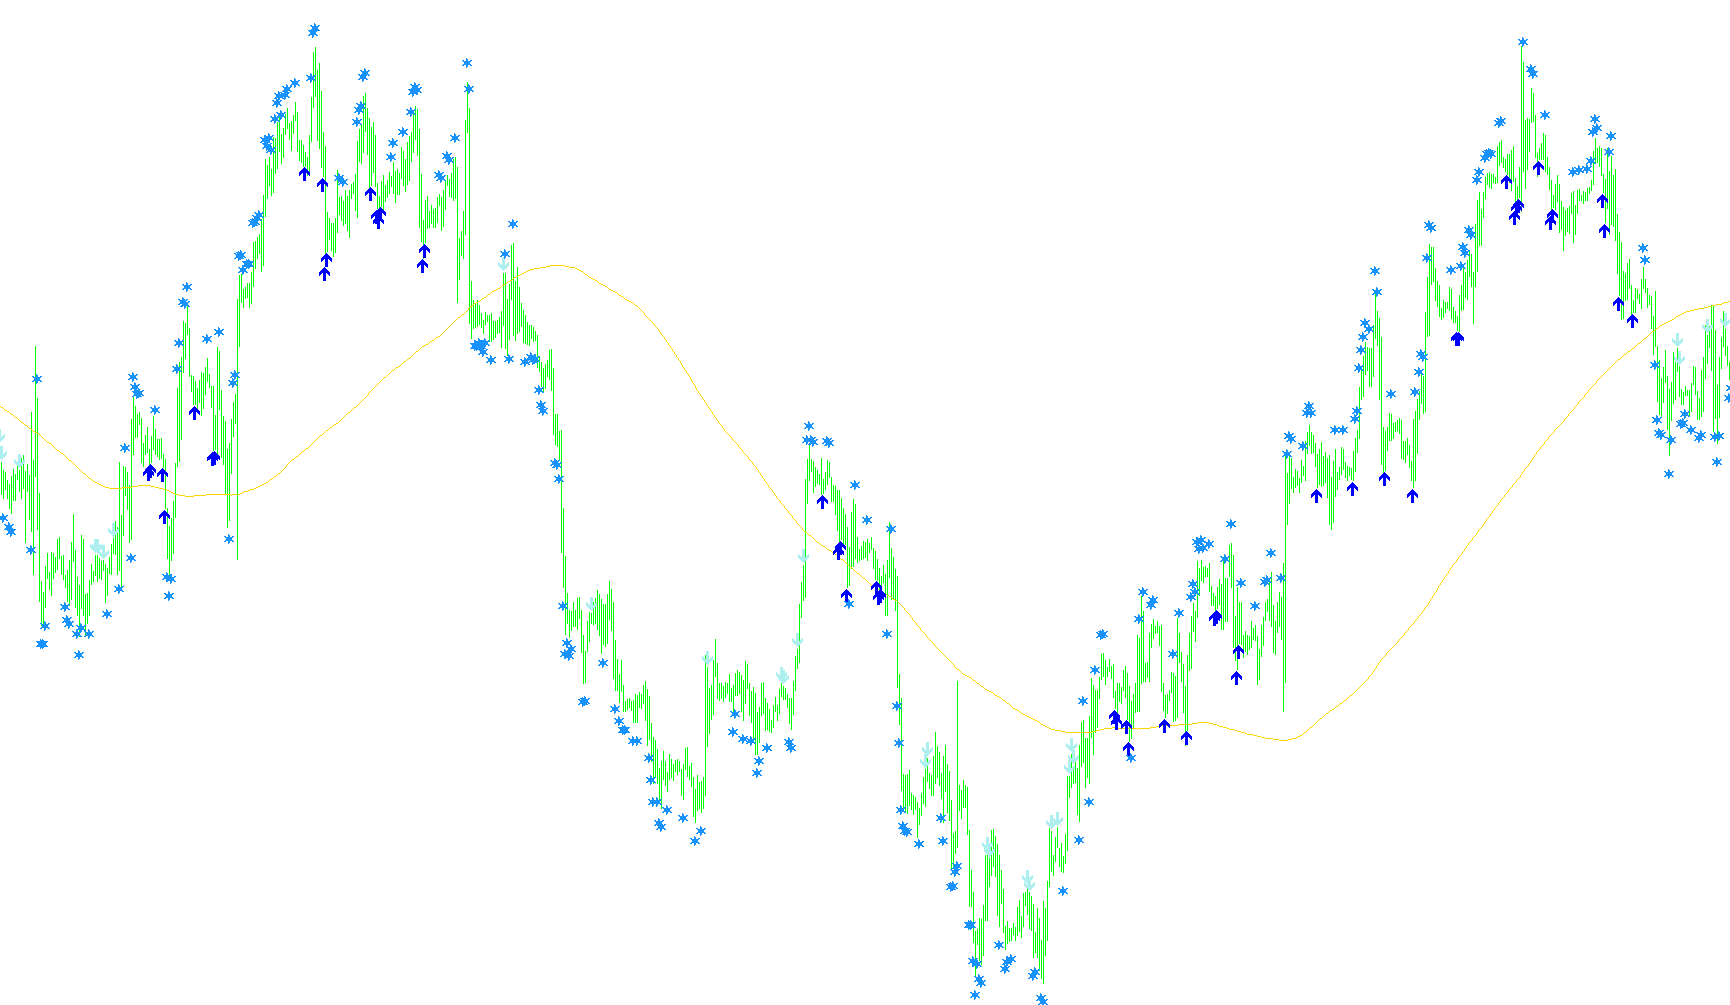
This indicator identifies high-probability trend reversals by detecting sequential momentum shifts in RSI relative to a long-term SMA filter on a daily timeframe.

R2_Arrows_v2
Indicator

R2_Arrows_v2

iMAiRSI

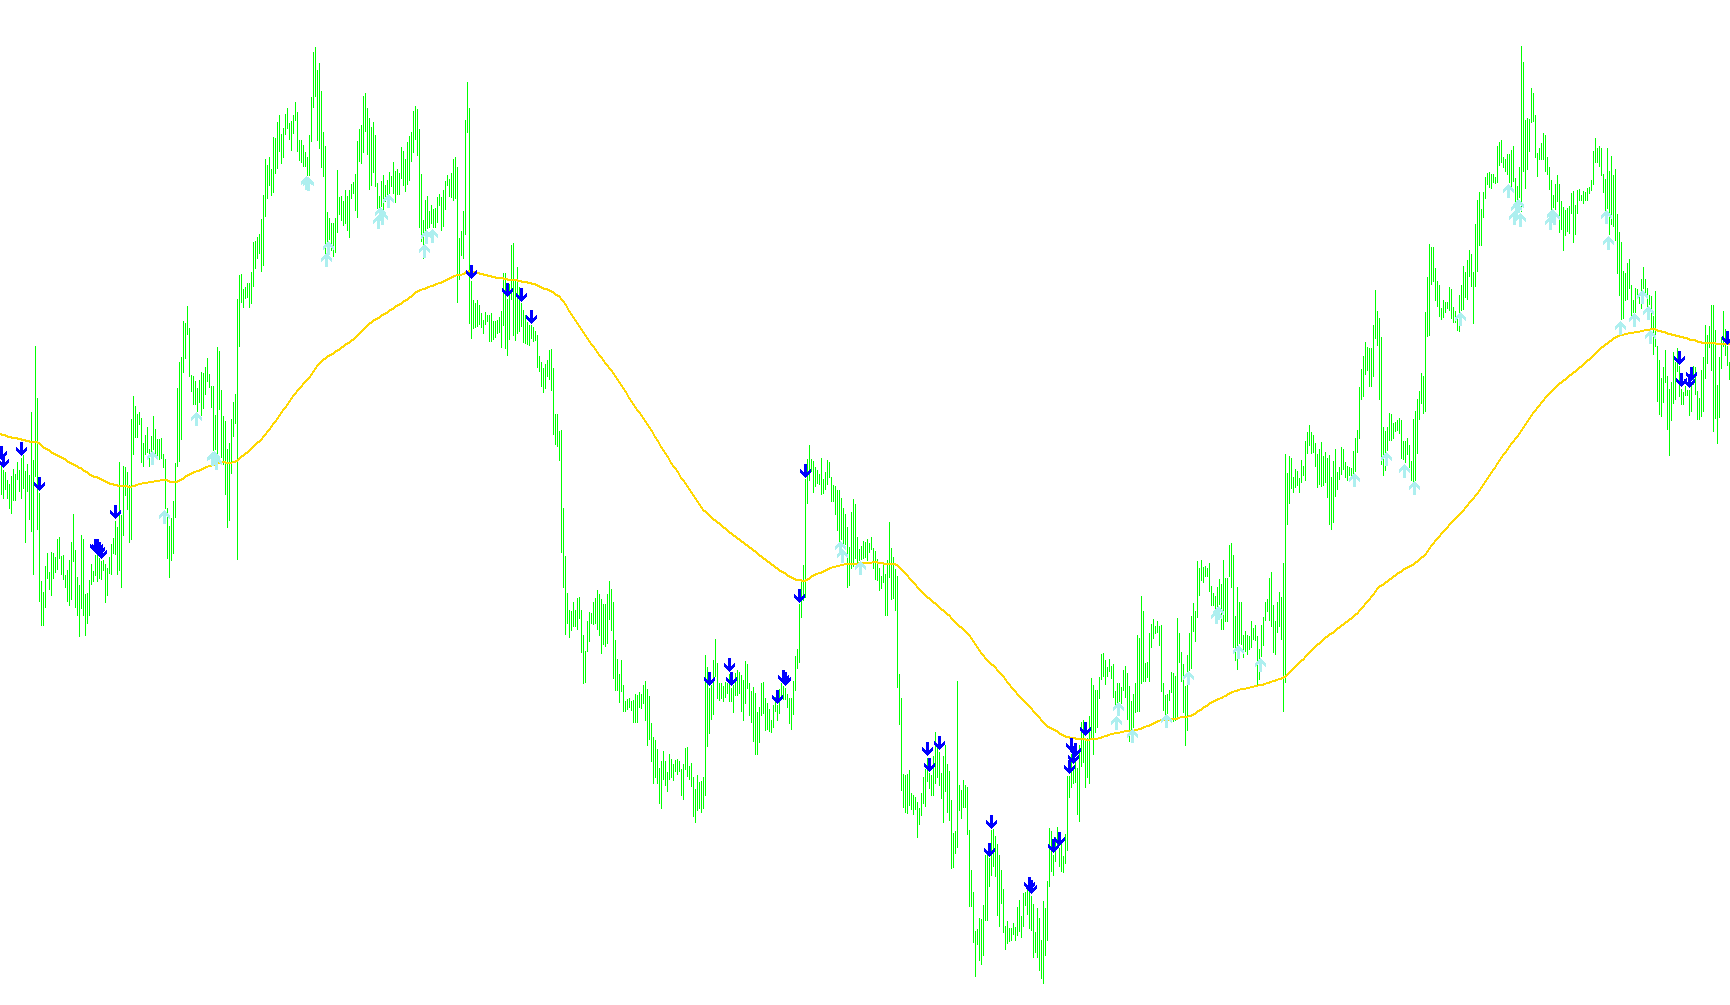
This indicator identifies momentum shifts by combining long-term SMA trend filtering with sequential three-period RSI acceleration to trigger directional arrows and exit signals.

R2_Arrows_v3
Indicator

R2_Arrows_v3

iMAiRSI

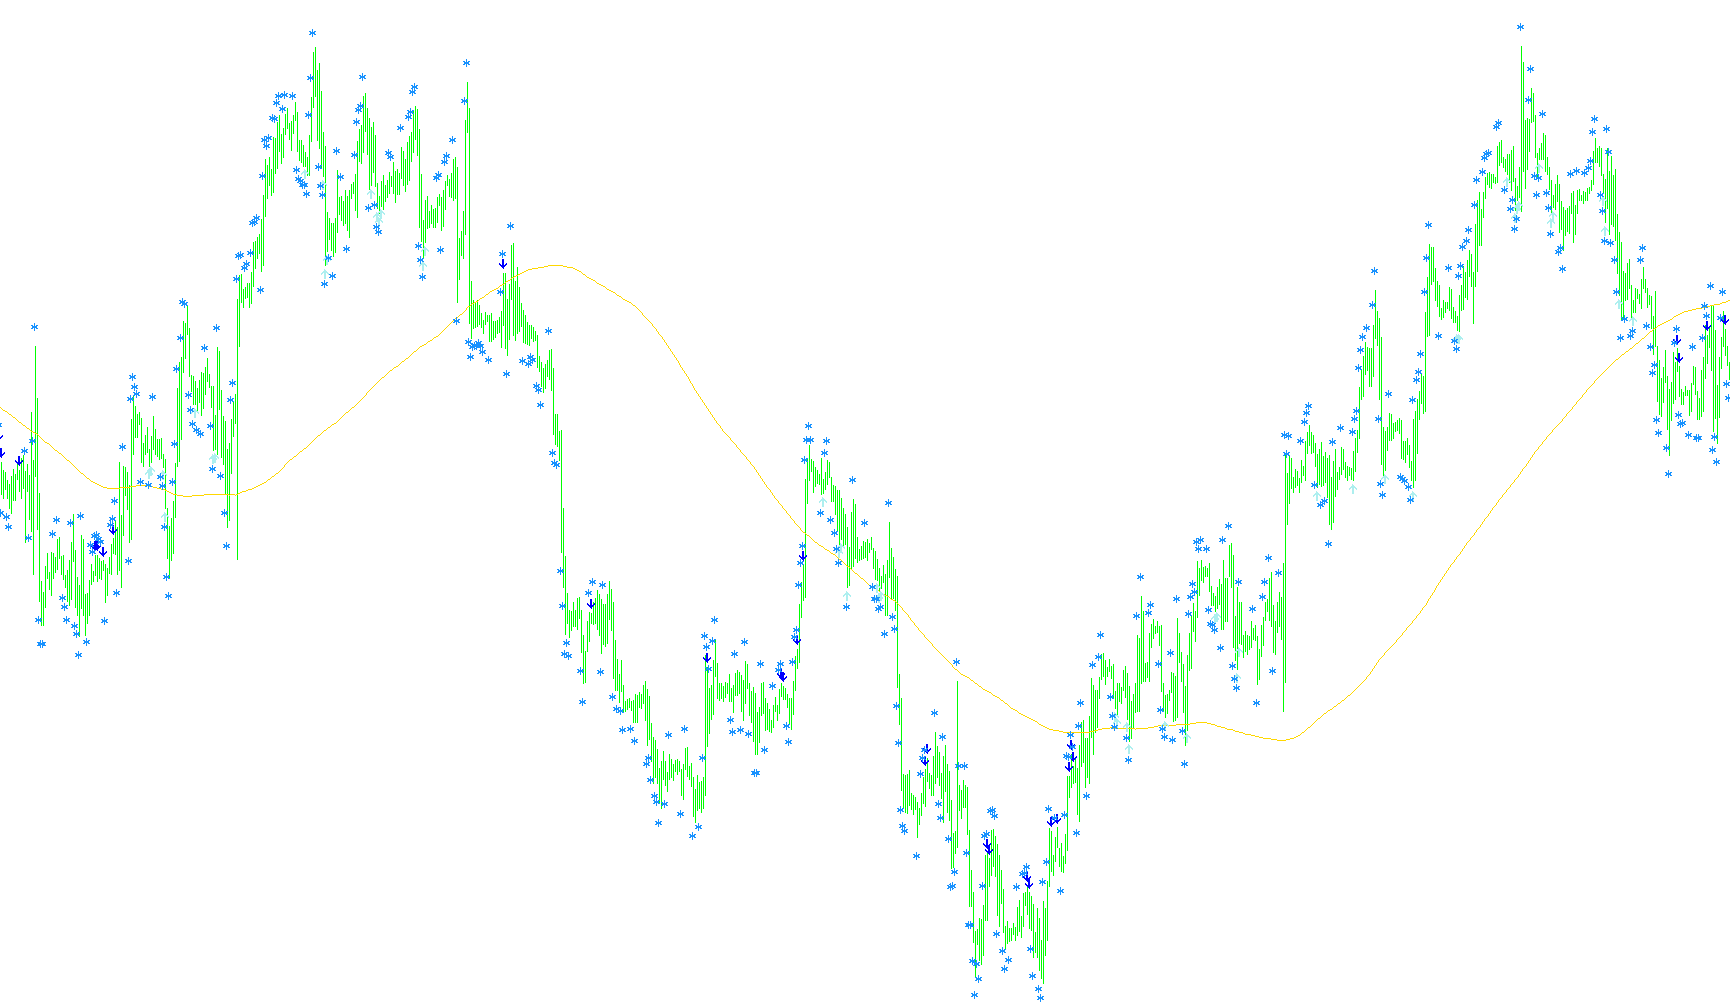
This indicator identifies trend-aligned entries by detecting three consecutive declining or ascending RSI values relative to a moving average while signaling potential exits via extreme momentum reversal thresholds.

R2_Arrows_v4
Indicator

R2_Arrows_v4

iMAiMAOnArrayiRSI

This indicator identifies trend reversals by combining Hull Moving Average price action with a sequential multi-day RSI momentum progression for precise entry and exit signals.

R2_Arrows_v4a
Indicator

R2_Arrows_v4a

iMAiMAOnArrayiRSI

This indicator identifies trend-following entry points by detecting price closure relative to a Hull or standard Moving Average coupled with sequential three-period RSI momentum shifts.

R2_Arrows_v4a1
Indicator

R2_Arrows_v4a1

iMAiMAOnArrayiRSI

This indicator identifies trend reversals by detecting escalating RSI momentum slopes relative to price positioning against a Hull Moving Average or standard moving average baseline.

R2_Arrows_v4b
Indicator

R2_Arrows_v4b

iMAiRSI

This indicator identifies high-probability reversal points by detecting three consecutive periods of accelerating RSI momentum while the price action remains aligned with a long-term moving average trend.

Rads 2MA Crossover-2
Indicator

Rads 2MA Crossover-2

iMA

This indicator detects dynamic trend reversals by identifying the precise intersection of two customizable moving averages and plotting visual cues along with real-time notifications.

Rads HAS Ext
Indicator

Rads HAS Ext

iMA

This indicator identifies momentum shifts by visualizing the intersection of four distinct Exponential Moving Averages calculated from Close, Open, and Median price points across varied timeframes.

Rads HAS-1
Indicator

Rads HAS-1

iMAiMAOnArray

This indicator synthesizes smoothed moving average data with Heiken Ashi price reconstruction to filter market noise and highlight underlying trend momentum.

Rads MACD
Indicator

Rads MACD

iMA

This indicator calculates the difference between two weighted exponential moving averages to identify trend reversals via histogram polarity shifts.

Rads MACD_v1
Indicator

Rads MACD_v1

iMA

This indicator calculates the variance between two weighted exponential moving averages and visualizes directional momentum shifts via a dual-color histogram.

Rads SMAC-D
Indicator

Rads SMAC-D

iMAiMAOnArray

This indicator calculates a MACD derivative by subtracting two exponential moving averages of weighted prices and applying a smoothed signal line.

Rads Wall-4
Indicator

Rads Wall-4

iMA

The indicator visualizes momentum dynamics by contrasting fast and slow Exponential Moving Averages derived from price close, open, and median values to identify trend structural shifts.

Raghee Vague
Indicator

Raghee Vague

iMA

This indicator identifies trend momentum and volatility by plotting EMA-based price boundaries and detecting specific crossovers between the closing price and 34-period high/low smoothing lines.